Friday 27 November 2020

Six Sigma for Small- and Medium-sized Businesses

Six Sigma Study Material, Six Sigma Guides, Six Sigma Certification, Six Sigma Prep, Six Sigma Career

One of the more familiar dilemmas in business today is how to implement Six Sigma in small and medium-sized companies. This is a serious issue because larger companies are beginning to mandate Six Sigma to their supply base as a condition of doing future business. The problem arises when small and mid-sized organizations solicit deployment proposals from Six Sigma consulting companies only to learn that the traditional Six Sigma implementation approach can require millions of dollars in investment, dedication of their best full time resources, and training of the masses. Those of you who have experienced this situation will agree that this approach to Six Sigma is unrealistic for smaller and mid-sized organizations. But there still exists a real need to bring smaller and mid-sized companies into the Six Sigma fold, because collectively they might represent as much as 75 percent-80 percent of total value stream activity.

The traditional top-down implementation approach is a major barrier to entry for smaller and mid-sized companies, and it doesn’t need to be. There are alternative Six Sigma deployment models that allow smaller and mid-sized organizations to implement at a pace where they can actually digest the methodology and achieve benefits, without the significant resource commitment and overhead structure of the traditional Six Sigma implementation approach. As a result, organizations are sometimes able to achieve faster and more impressive benefits than their larger customers.

One Size Fits All? – NOT!

One observation I’ve made about the Six Sigma implementation lifecycle is that the majority of benefits are not derived from Black Belts – they are generated at the Green Belt and Yellow Belt level, especially when the Six Sigma process becomes institutionalized. Another observation is that Black Belts and Green Belts are interchangeable for about 80% of the organization’s Six Sigma opportunities. Using a Green Belt and Yellow Belt approach addresses many of the constraints of smaller and mid-sized companies and allows them to implement at a more manageable pace. These organizations become just as technically skilled as their larger company counterparts; in fact, many are outperforming their larger customers in terms of both financial results and cultural transformation.

Scaleable Six Sigma – How It Works


Six Sigma Study Material, Six Sigma Guides, Six Sigma Certification, Six Sigma Prep, Six Sigma Career
Below is a brief eight-step process overview of a Six Sigma deployment and execution process I recommend for smaller and mid-sized organizations:

1. A Six Sigma strategy and overarching infrastructure is developed. The strategy, implementation approach and projects are directly aligned to the organization’s strategic plan and customer requirements. This step also includes well-organized communication and awareness building for Six Sigma.

2. Implementation planning is completed. Beyond the overall program, this includes defining objectives, scope, goals, priorities, work plans, deliverables, baseline performance, and expected performance/financial improvements for a pool of high-impact Six Sigma projects.

3. Team formation and the education plan begin concurrently. The Six Sigma strategy definition and implementation planning provides background and focus for the teams, and prevents wasted time and resources debating over what needs to be done. In addition, education is customized to business specific needs and includes sample issues, data and examples from their actual processes.

4. Executives complete Champion education where they learn about the Six Sigma process, methodology and tools. Executives also focus on how to lead, structure, and mentor a successful Six Sigma effort through several exercises. Although the Six Sigma approach is different in smaller and mid-sized companies, Executives must understand that Six Sigma still requires the same leadership and commitment as in larger companies.

5. Selected individuals complete Green Belt certification (e.g., a group of 25 individuals over a 2-3 month period). This education focuses on Six Sigma but it includes and integrates Kaizen and Lean. I believe a program should stress deployment of the right tools to the right opportunities, because not all problems require a complex statistical approach.

6. Other team members complete Yellow Belt certification (e.g., 25-50 individuals over a 2-4 week period). This education focuses on the basic “blocking and tackling” tools of Six Sigma, as well as Kaizen and Lean.

7. Later in the lifecycle, individuals are transitioned to the next level of Six Sigma achievement. Some selected Green Belts are developed into Black Belts, and some Yellow Belts are developed into Green Belts. Other new resources are developed into Green Belts and Yellow Belts respectively based on need. The goal is to ramp up to a point where the tangible savings is funding the Six Sigma program.

8. In all cases, certification is by achievement, not attendance. Beyond the classroom time, all certification candidates must complete a mandatory project that demonstrates the correct deployment of Six Sigma, solves a real business problem and achieves a targeted savings.

The above building-block approach can be modularized so that the organization can quickly transition their Six Sigma resources to the next highest level of achievement. Additionally, they can accomplish their Six Sigma implementation at a more manageable pace and scope. The number of projects, the levels of education, and the whole deployment and execution approach occur at a digestible pace, with a direct link to strategy and results.

There Is A Better Way


This above type of scaleable approach to Six Sigma enables smaller and mid-sized organizations to achieve results at a more manageable pace, while still achieving desired results. The “one size fits all” Six Sigma deployment model just isn’t practical for every company or organization, and other deployment models should be explored. The real need to bring smaller and mid-sized companies into the Six Sigma fold can be satisfied with the right deployment model.

Wednesday 25 November 2020

A Roadmap for Making Business Strategy Actionable

Six Sigma Tutorial and Material, Six Sigma Learning, Six Sigma Exam Prep, Six Sigma Guides

European businesses are often faced with the challenge of deploying centrally developed business strategies in a uniform manner, while at the same time accommodating local customer, market and regulatory differences. It is risky to assume that interpretations and adjustments across diverse European business geographies will simply happen. Likewise, it is unwise to believe that a well-defined business strategy will implement itself. No matter how well conceived by senior management, business strategy becomes virtually worthless when others in the organization misinterpret it, block it or simply do not know how to act on it.

Business leaders and practitioners need a framework for guiding the mobilization of an organization around its strategic plan. Such a roadmap enables business leaders and members to clearly understand each element for rolling out a strategy. It details what decisions need to be made, who needs to make them and when. This approach is translated into a project plan, specifying the nature of work in each of the associated phases of construction.

As shown in the figure below, the five phases of the roadmap are: illustrate, translate, indicate, dedicate and operate.

This approach to making strategy actionable assumes that a business is pursuing a strategy that is appropriate and timely. Methods used to develop a business strategy are broad, complex and well beyond the scope of this article. But regardless of the business’s level of maturity or the approach with which it executes its strategy, the roadmap is designed to illustrate the elements which a business needs to consider when making strategy actionable. It is not necessarily designed to be prescriptive in terms of the precise sequence in which these elements are addressed. It does, however, acknowledge the inter-dependencies of the elements and can serve as a framework for developing a plan for executing strategy. As the business evolves in the necessary capabilities and systems, the roadmap can be more thoroughly integrated into the existing planning cycles.

Six Sigma Tutorial and Material, Six Sigma Learning, Six Sigma Exam Prep, Six Sigma Guides
Five Phases of the Roadmap

Phase 1 – Illustrate


How is value really delivered to customers? In almost any business, products and services for customers are produced not by departments, but by processes which tend to cross functional lines. These are referred to as value delivery or core processes. Core processes have all the elements of the business processes (suppliers, inputs, boundaries, outputs and customers), but are far more significant in scope. They tend to be the way the customers identify with the company. Their effectiveness is directly tied to the extent they can satisfy customer needs and achieve the objectives of the business. Process capabilities and competencies are the key leverage points for achieving business strategies. It also is important to remember that core business processes allow the various elements of an organization to link its activities to the delivery of value to the market.

Then, if businesses define themselves in the market based on their core processes, where is it that the rest of the organization can make a difference? The answer lies in support, or enabling processes. These are the critical business activities that are required for an organization to operate, sustain and continually improve. Enabling processes provide their service to core processes, or internal customers. In this way, they provide the inputs, information and resources that “enable” the core processes to deliver value to external customers. If poorly performed, enabling processes can “disable” the core processes from being successful. Examples of enabling processes include recruiting, skills development, marketing, performance management and compensation, information technology, and administrative support services.

Just as external customers have demands of products and services, enabling processes are expected to meet internal customer critical-to-quality factors (CTQs). They must have measurement systems to evaluate and continuously improve their ability to meet core process requirements.

Phase 2 – Translate


Defining and agreeing on the strategy of a business is the responsibility of senior leadership. It is about making choices regarding what processes will be developed to deliver what products and services to what customers. Equally important, the top tiers of leadership must translate strategic objectives into operational terms. They must communicate the strategy in a manner that is meaningful to every member of the organization, for these are the people who must execute the strategy. This requires a business to consider its operations in the context of a whole – processes that are designed and linked to one another. Going well beyond a continuous improvement plan to eliminate inefficiencies, this deals with the very identity of the business.

One key to building accountability for the strategy is to be able to define the financial impact of each element of the strategy. In other words, if a business is to attempt a sustained 10 percent increase in revenue during the next three years, what is important is that the 10 percent annual growth in sales be translated into a net income figure. The “how” of the increase is what the strategy is all about. The “by” what means is what the strategy translation is all about.

It is critical that leadership define the strategy to this level of detail prior to attempting to communicate it to the business. The message must be crafted and communicated in a manner that each stakeholder perceives it to be relevant to him or her. If this cannot be done, it is a good indication that the strategy has not been sufficiently defined or thought out. It can be beneficial to include trusted members from different areas of the business to help in the translation process. This insures a cogent message delivered in a consistent way.

Also key to translating strategy is to identify and develop the areas of current operations that have the most significant impact on the business’s ability to achieve its strategic objectives. Randomly chosen operational improvement efforts may result in increased efficiencies and elimination of cost and non-value-adding activities, but they may have little or no strategic impact. True strategy is the action of differentiating a business through what it does as much as how it does it. Differentiation is achieved by performing value delivery processes in a unique and complementary fashion. Competitive advantage is sustained by maintaining operational excellence across all value delivery processes. Once operations are prioritized according to strategy, a business can assess the current levels of performance relative to the levels desired. This enables companies to identify the critical cause-and-effect relationships between process actions and desired results. Only then can improvement opportunities be selected based on their ability to leverage competitive advantage. One key to building accountability for the strategy is to be able to define the financial impact of each element of the strategy.

Phase 3 – Indicate


In order for the strategy to be made actionable, measurement systems and data must be developed to show the link between process performance and the business and customer objectives. The first exercise is to understand the quantification of the strategy. If the strategy is achieved, what will the business processes be able to deliver? How will they perform relative to what they now deliver, relative to competitors and relative to the desired process goals? Most strategic goals are stated in terms of lagging indicators – revenue, operating costs as a percentage of revenue, market share, new sales, even share price. But there are an infinite number of ways to effect those measures – some that may be in direct conflict with the desired direction of the business. These lagging indicators are used to define, establish and communicate the strategy of the business. The challenge, however, is to direct and coordinate every member of the business into activities that have a cause-and-effect relationship with the desired outcomes of the business.

Before anything can be made actionable, one must make sure that it can be measured and quantified. Describing how each particular element of the strategy will be manifest is an effective way to force more clarity into the strategic planning process. If the leadership of the business cannot describe what a particular aspect of the strategy will look like when it is achieved, how could that translation be expected of the business?

Understanding how the business improves on the delivery of value to its customers is only the first step of integrating improvement with strategy. Management must have real-time information on how well the processes are performing relative to the process performance levels required by the strategy. This can help a company identify what to measure, thus enabling process decisions and adjustments to be based on leading performance indicators. Awareness of the strategy is not sufficient to ensure its achievement. Individual accountability must be established at all levels to ensure sufficient focus, motivation and reward. This includes operational and organization development performance indicators as well as more traditional financial and customer satisfaction measures.

Phase 4 – Dedicate


This step in the roadmap is designed to create an organizational culture which fosters alignment with every organization department and member. Leaders themselves demonstrate the process and data-based decision-making behaviors that serve as models for the rest of the business. Activities in this phase include:

◉ Engage and make accountable the personnel necessary to achieve, sustain and continuously improve process performance

◉ Allocate the right process indicators and measures to the appropriate personnel

◉ Design appropriate process performance reporting disciplines and procedures

◉ Develop and implement visual management systems

◉ Train and engage personnel and process management teams

◉ Link process performance to individual performance management systems

Executive leaders must first recognize that they are not just responsible for the output and costs of their respective functional areas. Each executive must both share accountability for the performance of the value delivery processes and ensure proper integration and coordination of the processes across the business.

Phase 5 – Operate


Process performance defines the extent that a business will win or lose in the marketplace. In the final phase of the roadmap, process management systems are integrated as a decision-making tool and discipline to continually adjust and direct the improvement efforts of the business. Not only does the approach compel organization-wide improvement that is linked to achieving strategic business priorities, but it fosters a high-involvement, high performance culture that can become self-sustaining without reliance on external consultants.

Process management systems can vary greatly in terms of complexity and organizational scope. While the effort and resources required to develop variously sized systems can be significant, there are some fundamental aspects that are common to all process management system deployments. It is these fundamental components that can best be addressed using a standardized approach, or roadmap, to assure that the right people are involved in answering the right questions at the right time. It also serves as a framework for the project plan that will effectively manage the many contributions by organization leadership and members.

Some of the activities associated with the operate phase of the roadmap include:

◉ Conduct process and process-based performance management systems per design

◉ Evaluate process performance and prioritize improvement opportunities

◉ Determine appropriate methodologies for addressing improvement opportunities

◉ Train, engage and dedicate appropriate personnel in process improvement efforts

◉ Assess changes in business environmental conditions (e.g. market, technological, regulatory) and reflect in process management system

Tuesday 24 November 2020

How to meet seemingly impossible project deadlines

Prince2 Study Material, Prince2 Certification, Prince2 Exam Prep, Prince2 Career

It is reported that only around half of all projects come in on time. Seemingly impossible deadlines are the downfall of many projects, and late delivery is reported to be the reason why projects fail to an extent 49 percent of the time.

So, what action can we take when deadlines are fast approaching? Here we look at the tactics project professionals can adopt in order to complete projects on time, even when the odds are stacked against them.

Be realistic from the start

The first, and arguably most important step to meeting any deadline, is to be realistic about its achievability from the get-go. Take the time at the project initiation stage to set out what resources and budget are available to the project and map out whether meeting the deadline is possible. If it’s not, recognise this, and take action.

Going back to senior management and stakeholders with the news that the project meeting their deadline is impossible will cause disappointment, but it is by far the better option than inevitably missing the deadline further down the road. Create an open dialogue with them. Maybe the project can be extended after all, or perhaps there is some extra budget available to take on more staff or resources. It is paramount that you flag the challenges and go back to seniors to negotiate.

Project managers can be particularly guilty of promising the earth when shooting to win new business. But by being realistic about the ability to meet a deadline at the pitch stage, expectations are better managed, and reputations can be saved.

Scale back the scope

If an impossible deadline is truly immovable and extra resources are out of the question, a perfect resolution can be scaling back the project scope. Again, this is best negotiated at the initiation stage of a project.

Work with your client or management on a version of the project which has a second phase. The first phase should be fully-functioning, but a paired-back spec with some ‘nice-to-have’ features removed, which can then be added and built upon as part of a follow-up project. Generally speaking this approach pleases everyone – the client gets their key deliverables by the deadline, and you get the repeat business of a second phase of the project.

Again, prioritise open communication. Even if you start out full of optimism and sure you are going to complete in time only to realise half way down the line that the scope is not realistic, then ensure you communicate that to your bosses.

Upskill across the board

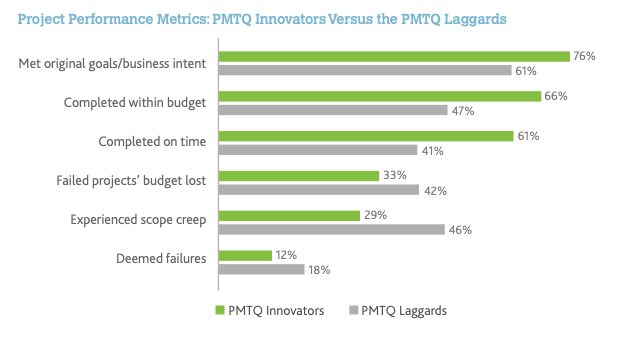
Generally speaking the more skilled and experienced your team are, the more successful the project will be. PMI’s Pulse of the Profession survey 2019 evidenced this when they studied the performance of PMTQ Innovators vs. PMTQ Laggards.

[PMTQ stands for Project Management Technology Quotient. TQ refers to how able a person is to adapt, manage and integrate technology based on the needs of the organization or the project at hand.]

The study measured performance of Innovators - those who prioritise digital skills and knowledge and commit to a strong project management culture, versus the laggards for whom these are less of a priority. The findings were astounding, with PMTQ innovators far more likely to complete a project on time, and meet original goals compared with PMTQ laggards.

Prince2 Study Material, Prince2 Certification, Prince2 Exam Prep, Prince2 Career

The study concluded that PMTQ innovator organisations take the lead on project outcomes. They save money, improve stakeholder satisfaction rates, meet goals, and deliver on time and within budget, whilst also reducing scope creep and outright failure.

The key difference between laggards and innovators is their technology knowledge and skills, and their core Project Management capabilities. This tells us that organisations who prioritise project management skills development, provide ongoing training and have formal processes for developing competencies, are more likely to succeed.

The takeaway: by actively taking steps to upskill across the board in key areas such as core project management skills, and technology know-how, project professionals can thrive, meet deadlines, and make projects a success.

Up your resources


Extra resources can push you over budget, but if you have followed our advice to be realistic from the start, then taking on extra resources and/or extra staff can be a great option for ensuring you meet a deadline.

Having a business “little black book” of contacts who you can call upon - even at short notice - can be an invaluable resource. Your connections should include:

A bank of freelance professionals who can be the extra help you need for any given project. Freelancers are perfect for projects that need skilled professionals on a short-term basis.

Temporary office, desk, or meeting spaces - whether in a different city, or simply in addition to your existing office. We Work and similar companies are an ideal solution for this.

Flexible technology contracts - software or hardware resource which you may not need year round but you can employ on a by-project basis, or even extra manufacturing resource which you can call upon on a temporary scale.

Having a network of contacts can be of great benefit. Be sure to have more than one contact for each skill/area in case one is unavailable, or simply because they will have differing specialisms.

Source: prince2.com

Friday 20 November 2020

Quick Wins Can Successfully Launch Operational Excellence in Healthcare

Six Sigma Tutorial and Material, Six Sigma Exam Prep, Six Sigma Career, Six Sigma Learning

From January 2012 to September of 2016, there was a minimally formal quality improvement and assessment program (QAPI) within the Mayo Clinic Transplant Center in Phoenix, Arizona. Attempts had been made to grow the program, but success was limited, as assessed by broader metrics of process improvement projects, engagement by the organization, and standardization of metrics, meeting cadence, and outcomes reporting. Improving the structure and formalization of the QAPI program can improve the transplant process effectively and efficiently to enhance the patient experience and improve volumes and outcomes.

Aim Statement


We aimed to create a formalized QAPI program for the Transplant Center with a set of standardized metrics and outcomes reporting, engagement in quality improvement from the organization, and process improvement projects by December 31, 2019.

Define and Measure


The Define, Measure, Analyze, Improve, Control (DMAIC) process improvement methodology was used. In the Define and Measure phases, an overall assessment of the Transplant Center was performed. First, the scope of the program was determined through an assessment of strategic vision, mission and objectives as well as a formal gemba walk of high-level processes. This also helped define customer requirements, which led to gathering baseline data on those requirements.

Vision: Mayo Clinic Transplant Center in Phoenix will be the most trusted partner for health care and be recognized as a premier patient-centered academic transplant center.

Mission: Mayo Clinic Transplant Center in Phoenix will inspire hope and provide the best care to every patient through integrated clinical practice, education and research.

Strategic Objectives:

◉ Increase preference for Mayo Clinic Transplant Center in Arizona among physicians and the public.
◉ Grow transplant volumes, particularly living donor programs.
◉ Increase customer satisfaction: patients, referring physicians and third-party payers.
◉ Enhance financial performance.
◉ Improve patient access and navigation.
◉ Enhance patient safety.
◉ Sustain high quality in each organ program.
◉ Recruit, train and retain the best staff.
◉ Develop research and education programs.
◉ Promote organ donation in the community.
◉ Develop and mature existing partnerships and collaborations.

The team developed an understanding of key transplant metrics as well as established outcomes reporting, a QAPI meeting schedule and a formal QAPI plan.

Six Sigma Tutorial and Material, Six Sigma Exam Prep, Six Sigma Career, Six Sigma Learning

Figure 1: Transplant Process

Additionally, an assessment of engagement in quality was made. At the time of this assessment, the key measures for the overall QAPI program were engagement (defined as number of people trained in QI; baseline: 2 persons), QI projects executed (baseline: 1) and standardization of metrics and outcomes reporting (baseline: 0).

Analyze


In the Analyze phase, high-level process maps and root cause analysis were used to identify key factors contributing to the gaps in obtaining and reporting the metrics, meeting cadence, standardization of reporting and presentations, and project generation and documentation of QI activities.

Six Sigma Tutorial and Material, Six Sigma Exam Prep, Six Sigma Career, Six Sigma Learning

Figure 2: Root Cause Analysis Exercise

Root causes found included, but were not limited to:

◉ Lack of sense of urgency for QI
◉ Physician and leadership engagement
◉ Lack of communication regarding the vision, mission, strategy and objectives
◉ Employee training and awareness of QI
◉ Lack of formalized schedule and prioritization for QAPI meetings
◉ Lack of prioritization and alignment of strategic objectives and QI
◉ Lack of accountability on action plans – minor improvements to the practice
◉ Lack of formal QI project generation and documentation
◉ Misalignment of operations and quality definitions
◉ Lack of QI expertise resources within transplant

Improve


In the Improve phase, interventions began to be implemented around standardizing the scheduling of QAPI meetings, the adverse event process, data reporting, data automation, metrics/outcomes needed for presentations, and formalized QI training and project generation. This was created over a phased approach to aid in change management for the organization (see Figure 3).

Six Sigma Tutorial and Material, Six Sigma Exam Prep, Six Sigma Career, Six Sigma Learning

Figure 3: Phased Approach

One of the first steps was clarifying the sense of urgency for QI, engagement and communication. QAPI meetings were reinvigorated by leadership, then formalized and standardized in terms of timing. A template presentation for the QAPI meetings as well as a holistic dynamic dashboard were developed from multiple sheets (N=15, 280 entry fields) to simplify the key metrics that were required and needed to understand the practice as a whole. Automation of those key metrics was then incorporated into the presentation packages to aid in efficiency and effectiveness of the use of the data for decision-making as well as a final website using an analytic software called Tableau (see Figures 4 and 5).

Six Sigma Tutorial and Material, Six Sigma Exam Prep, Six Sigma Career, Six Sigma Learning

Figure 4: Data and Presentation Flow

Six Sigma Tutorial and Material, Six Sigma Exam Prep, Six Sigma Career, Six Sigma Learning

Figure 5: Simple Dynamic Dashboard

During the phased approach, an 80/20 strategy was deployed for projects, engagement and confidence builders to the organization. Early in the phases, 80 percent of projects would be small in scope with a high variation of metric, while 20 percent would be large in scope with potentially inconsistent or no data available. As the organization progressed in projects, engagement and confidence, this relationship would reverse: 80 percent focus on large-scope projects and 20 percent on small confidence-builder projects.

Training

In addition, a transplant-specific Silver Quality Essentials course (a diluted version of an industry-standard Yellow Belt training) was integrated with a standardized Mayo course from Quality Academy, featuring tailored examples to transplant data, time and resources. This training allowed for not only QI awareness and education but change management to garner the confidence of the organization – both of QI itself and to drive more project generation.

Started as Flow-Based System


Prior to formal training execution, the final aspects of the business review were performed to help scope projects. The Transplant Center lacked a formal prioritization method but the system was largely a queue/flow-based system. Standard Lean and operations management principles can be quickly applied to harvest confidence-builder projects in this type of setting. The team’s first exercise involved using Little’s Law to articulate the flow of the system and where bottlenecks may lie. From there, Six Sigma tools were used to address variation reduction. Both of these methods led to the unique targeted approach for this culture and situation to net the highest benefit.

Transplant = Flow system

◉ Transplant “factory” physics and math applied
◉ Little’s Law/theory of constraints – first set of assessment tools
◉ Six Sigma (defect reduction) – second set of assessment tools

Little’s Law Assessment (First Exercise)

WIP = R * T

Where,

WIP = waitlist patients (avg/year, active)
R = throughput rate (transplants/year)
T = lead time (referral to transplant [TX], avg 2020)

In this assessment, WIP and R were known and reported publicly. Standardized definitions for all transplant centers were available and were used as a base start to assess the organization.

For the assessment, T = WIP/R, which would facilitate what the organization should be operating at, defined by the Little’s Law proof.

Actual Lead Time for Three Organs 
  Kidney  Heart  Liver 
WIP 521 days 38 days 113 days
327 days 50 days   127 days 
1.59 years   0.76 years   0.88 years 

Source: SRTR, UNOS, Mayo Clinic EMR

From here, we know what the actual lead time should be for three organs: Kidney = 1.59 years, Heart = 0.76 years and Liver = 0.88 years. At the same time, a new internal tool was being developed (called EDITLIFE) that could give us the current-state lead times as they were happening internally. This current-state assessment gave us:

Current-State Lead Time for Three Organs
  Kidney  Heart  Liver 
WIP 521 days 38 days 113 days
327 days 50 days   127 days 
1.75 years 1.4 years 1.21 years

The Kidney, Heart and Liver programs average lead times (referral to transplant) were 638, 511 and 441 days (1.75 years, 1.4 years and 1.21 years, respectively). Notably, the Heart program was operating at two times the lead time that it should be. Knowing that many of the processes have the same set of bottlenecks – such as a holistic meeting of review of patients called “Selection Conference” and a slew of insurance authorizations – now we moved to our Six Sigma and variation reduction tools (second exercise) to precisely target our confidence-builder projects.

The analysis of variance (ANOVA) test showcased that while there was a statistically significant difference between the groups (p-value = 0.0067), the Kidney program had the majority of the variation followed by the Heart program, as shown in the Tukey-Kramer Connecting Letters report. (See Figure 4.)

Six Sigma Tutorial and Material, Six Sigma Exam Prep, Six Sigma Career, Six Sigma Learning

Figure 6: Six Sigma Work

What is critical here is the ANOVA showed us that our biggest win would come from the Kidney program (more samples = 248 kidney transplants vs 40 for heart transplants during the analysis period), not from the Heart program as one might expect. We now knew how to guide the organization into its first set of projects. When the Kidney team members came to training and we asked, “What is your biggest problem in the Kidney Transplant Center?” they replied, “Speed to getting a transplant!” That translated to lead time.

Our first project, thus, was a Kidney transplant “selection to listing” lead time project that lead to massive improvements for the organization. We worked to build the relationship, confidence and rapport with the teams.

Had we not chosen a guaranteed “winner” project to start, in the absence of a formal strategic prioritization of processes like business process management (BPM), our success story may have never occurred.

From September 2016 to the end of December 2018:

◉ 68 individuals were trained in QI
◉ 100 QI projects (10 DMAIC, 12 PDSA and 78 action plans) were completed
◉ A formal standardized dashboard, standardized presentation QAPI package, consistent QAPI Subcommittee meeting schedule and formalized communication foundation for leadership engagement and process flow were enabled

QI engagement (as measured by training) and QI projects and outcomes summary graphs are featured in Figures 7 and 8 and Table 2, respectively. Finally, our counterbalance of patient satisfaction stayed the same, which we consider a success; we were able to move patients faster through our system without adversely affecting their satisfaction (see Figure 9).

In total, the cumulative return on investment (ROI) of this operational excellence deployment model was $28.8M. Of this, $11.2M were from operations cost reduction and efficiency gains (net present value [NPV] method used) and $17.6M were from revenue increase models, attributed to one project (Living Kidney Donor Transplant Improvement) with standard revenue recognition models used for this measure.

Six Sigma Tutorial and Material, Six Sigma Exam Prep, Six Sigma Career, Six Sigma Learning

Figure 7: Engagement via Training

Six Sigma Tutorial and Material, Six Sigma Exam Prep, Six Sigma Career, Six Sigma Learning

Figure 8: QI Projects

Six Sigma Tutorial and Material, Six Sigma Exam Prep, Six Sigma Career, Six Sigma Learning

Table 2: Detailed Outcome Summaries (Click to Enlarge)

Table 3: Simplified Outcome Summaries

Results Benefits to Patient 
Reduced immunosuppression documentation errors from 3 errors/month to 1 error/month Induction errors documentation – pharmacy, nursing and anesthesia collaboration to reduce the documentation errors of drug dosages given to patients 
· Reduced non-value-added calls to transplant call center from 1,420/week to 1,100/week
· Moved flow of non-value-added calls to message center 
Effective call center triage – reducing the number of non-value-added calls made to the transplant call center to effectively manage appropriate calls 

· Reduced selection to listing time frame from 73 days to 18 days
· Reduced FTE from 22.5 hours/week to 4 hours/week
· Reduced overall referral-to-listing time frame from 281 days to 177 days

Selection to listing process change – historically, patients were brought to selection conference without all evaluations completed for discussion 
Improved ABO verification compliance from 85% to 97% across all organs  Opportunity to reduce ABO verification errors with heart and liver, first, followed by kidney – all solid organ transplant programs 
Improved process for liver patients getting feeding tube placement, logistics and financing  Optimizing the flow for feeding tube process for liver patients 
· Reduced the time from 289 min/request to .46 min/request
· Increased the effectiveness of knowledge gained from 58% to 100% 
Reducing the time and increasing the effectiveness of the transplant scheduling team with regards to scheduling processes 
Increased awareness on transplant quality data knowledge from 81% to 100%  Metrics awareness project for 3W nursing team (CMS item) 

· Reduced waitlist time for kidney patients from 633 days to 458 days
· Increased organ offer acceptance from 40% to 51% for high KDPI kidneys
· Maintained patient active/not active waitlist 

3 DMAIC projects in 1 – UNOS collaboration for high-risk kidney donation 
Reduced referral-to-listing throughput time from 72 days to 46 days  Reducing the time from referral to listing for heart program candidates 
· Reduced referral data accuracy rate from 89% defective to 0% defective
· Reduced 77 hours of FTE wasted time on error connections annually 
Referral data accuracy for all organ groups 
· Reduced recipient evaluation to transplant from 289 days to 126 days
· Reduced donor referral to donation from 163 days to 147 days 
Reducing time from referral to transplant for both recipients and donors 

Six Sigma Tutorial and Material, Six Sigma Exam Prep, Six Sigma Career, Six Sigma Learning

Figure 9: Counterbalance – Patient Satisfaction

Thursday 19 November 2020

Go Ahead in Your Career with A Six Sigma Certification

six sigma, six sigma tools, six sigma green belt, six sigma black belt, six sigma yellow belt, six sigma certification

The Six Sigma Process

In most straightforward terms, the Six Sigma process is a quality control program. When it was developed, its goal was to reduce manufacturing defects and improve cycle time. Over the past several decades, the plan was used to address a broader range of general business needs, such as maintaining and enhancing business products and services, increasing customer retention, and better meeting customer demands.

In more advanced terms, the goal of this process is to make analytical improvements to business processes. It decreases focus on qualitative markers in qualitative measurements of success-thinks project management, financial analysis, and statistics.

Success is seen as efficiency, known as a business process with less than 3.4 defects or problems, anything that does not meet the consumer, per one million chances. At its core, a Six Sigma process advocates that all business methods can be optimized through measurement.

How to Get Six Sigma Certification?

Six Sigma is a quality management methodology that enhances process outputs by identifying and eliminating the causes of defects and minimizing business variability.

1. Consider the Needs of Your Organization

It would be great if you first analyzed what Six Sigma certification is best for you. Is it bearing from too much wastage in the supply chain?

2. Decide on How You Need to Optimize Your Processes

You should optimize the process continuously. On the other hand, you might be someone who opts for the stress on performance or providing a quality product with a little waste.

3. Determine Whether You Require Six Sigma or Lean Six Sigma

It would be best if you chose according to the terms of your environment. It would be best if you opted for what you need. Six Sigma defines waste as a change within business processes. If you are someone who believes inconsistent processes, you have to be compatible with this process.

Lean is a blend of Lean methodology and Six Sigma. It defines waste as such things that do not add value to the finished product. If you are looking for an emphasis on efficiency, you should go for Lean Six Sigma.

What Does the Six Sigma Hierarchy Do Inside the Organization?

Black Belts keep all team members on the course to reach goals and deadlines. Their first task is project management; they are the individuals who define a project and its reach.

Green Belts are Professionals who run strictly under Black Belts, accountable for doing most of the data collection. Green Belts usually are employees of an organization who also have other day-to-day responsibilities within that company's framework.

The Yellow Belt designation refers to employees with basic training in quality improvement methodology and who participate in related projects. They have a basic understanding of the method and assume a supportive role to Green and Black Belts within a Team.

During a company-wide Implementation, specific issues and problems may occur. Experts like Master Black Belts can better resolve issues that come along and offer appropriate solutions to teams.

Regardless of your organization’s size or industry, the method can improve your internal processes and drive better outcomes. This strategy relies on the people who implement it, creating excellent leadership development opportunities among your staff. So, while it might not be a supersecret martial arts fraternity, still packs quite the punch.

What Are the Six Sigma Career and Salary Prospects?

It is a big way to climb up the career ladder with cool job titles and to match salary possibilities. Companies that routinely hire candidates to fill Sigma Six positions include Abbott Laboratories, General Electric, The Hershey Company, Newell Rubbermaid, Siemens, and Wells Fargo.

Six Sigma professionals have several career choices as manufacturing engineers, agreement engineers, and working system specialists.

Additionally, there are career opportunities with the following titles, although the correct terminology can vary from company to company:

  • Six Sigma Analyst
  • Six Sigma Black Belt
  • Six Sigma Consultant
  • Director of Operational Excellence
  • Functional Project Lead
  • Senior Project Manager
  • Six Sigma Projects Manager
  • Business Process Manager
  • Lead Analyst/Project Manager

In terms of salary, a Six Sigma Green Belt certified can expect an average yearly salary of $71,019 per year.

Conclusion

Each of the Six Sigma and Lean tools can be used independently or in conjunction with another to maintain a business achieve quantifiable goals. Most companies that adopt these tools enjoy measurable results in quality improvement, staff engagement, cost savings, and customer satisfaction.

Wednesday 18 November 2020

Best Practices for Process Maps at California High-Speed Rail Authority

Six Sigma Tutorial and Material, Six Sigma Prep, Six Sigma Certification, Six Sigma Guides

The California High-Speed Rail Authority is working to build a true high-speed rail system – something that has never been done in the United States. For any new endeavor, knowing your business processes is critical, and the Authority generally depends on process maps to understand who does what and when across the high-speed rail program. These process maps are used by:

◉ New hires to learn the work they will be doing

◉ Cross-functional teams to understand the role they play in a business process

◉ Executives to understand exactly the work that is being done and by whom

◉ Our Information Technology team to configure information systems

◉ Our Quality team to conduct audits

◉ Our Lean practitioners to identify opportunities for improvement

In short, the process maps have become our roadmaps to success. Presented here are a few of our process mapping standards and techniques.

Where to Begin?

When telling a story through a process map, it can be challenging to know exactly where to begin, especially when mapping a complicated process involving multiple cross-functional groups. Having the right people in the room, asking the right questions and making the distinction between process owners and task owners is key.

At the Authority, we start our process mapping sessions by asking: What is the goal? What is the expected outcome of this process? Identifying the goal gives you the process output. Next, we ask the question: What is the trigger? How do we know when this process begins? Identifying the trigger of the process gives you the input of the process. Since a process is essentially turning inputs into outputs, all there is left to do is identify the steps in between.

The Basics of Process Mapping

To ensure the consistency, continuity, quality and effectiveness of our process maps, we adhere to the following basic tenets:

◉ Define the output first. What is the goal?

◉ Define the process title based on the output. For example, if the goal of the process is to review and approve an invoice, title your process, “Invoice Review and Approval Process.”

◉ Define the input. What begins the process?

◉ Identify the steps necessary to turn the input into the output.

◉ Be sure every step is actionable.

◉ Every step should be measurable.

◉ Keep steps limited to a single action if possible.

◉ Describe steps using a present tense verb plus object statement, such as “Prepares package,” “Reviews report” or “Requests approval.” Describe the work the responsible individual or group does.

◉ A single step within a process may have many inputs, but it can have only one output. In other words, a step can have many incoming arrows, but only one outgoing arrow because there is no way to determine which path to follow if a step has two or more outgoing arrows.

◉ Use containers to represent simultaneous activity. A container can house multiple steps across multiple functional areas of activity that occurs simultaneously. For example, a container can be used to represent the concurrent review of a document distributed to multiple individuals at the same time. A container should have only one outgoing arrow.

◉ Identify roles and responsible functional groups based on the organizational chart. Be consistent.

◉ Identify the time it takes to complete each step within a process.

How much detail should a process map include? A process map should explain the who and what, but not necessarily the how. The how is better represented in desktop instructions or other documentation. We assign a level (1, 2 or 3) to our processes here at the Authority, an action we call leveling, to help determine the scope of information and degree of detail to collect and include in a map.

Three Process Levels

The process requirements for all of our process maps are derived from a combination of Authority contractual requirements, the Authority’s project management plan, the standard framework established by the Project Management Institute (PMI) and industry best practices.

A Level 1 map contains high-level information and typically represents a framework or management lifecycle. It is not cross-functional or role-based. The example shown in Figure 1 illustrates each of the functional areas within our Infrastructure Delivery Branch and identifies key processes in each of those areas. A Level 1 map is a great source for understanding the process requirements and responsibilities of a functional area. The following map shows the results of a preliminary analysis of key delivery processes. It was created for executive management as part of an analysis to identify process requirements and to determine the need for process improvement and/or supporting documentation.

Six Sigma Tutorial and Material, Six Sigma Prep, Six Sigma Certification, Six Sigma Guides

Figure 1: Example of a Level 1 Process Map (Click to Enlarge)

A Level 2 map, as shown in Figure 2, is cross-functional, typically spanning multiple functional areas across the organization. A Level 2 map is somewhat high-level and focuses on the cross-functional activity between functional areas or departments throughout the organization.

Six Sigma Tutorial and Material, Six Sigma Prep, Six Sigma Certification, Six Sigma Guides

Figure 2: Example of a Level 2 Process Map (Click to Enlarge)

A Level 3 (Figure 3) map is cross-functional, typically spanning multiple roles within a single functional area. A Level 3 map is a bit more granular in detail and captures the cross-functional activity at a task level between individuals within the same functional area or department.

Six Sigma Tutorial and Material, Six Sigma Prep, Six Sigma Certification, Six Sigma Guides

Most of our process maps at the Authority are Level 2, as our primary focus is the interaction between functional areas throughout the agency. Using different levels for our processes gives us a clear picture of the work that has been done and the work that is left to do. For example, if all we have is a Level 1 or Level 2 process map, we know there are still layers of the onion left to peel away to fully examine the process. Leveling our processes also helps to manage expectations and tells us exactly how many layers of the onion to peel to create the process map.

The Business Process Register


We consider our process maps valuable assets at the Authority, so we take special care in controlling and monitoring them. All of our process maps are housed in a custom SharePoint repository – the Business Process Register. Everyone in the agency can access the Register, and it is organized based on the structure of the agency. It mirrors our organizational chart, which makes it easy to quickly identify process owners, so we know exactly which functional group is responsible for any given business process.

The Register provides key performance metrics and important metadata we use to analyze our processes at an enterprise level. At a glance, the Register tells us who owns a process, who does the work, how many steps are in the process, how long it takes to complete the process and the cross-functional groups involved in producing the output. Each entry in the Register includes a link to a PDF of the process map. The Register also provides an audit function that allows us to periodically review our processes for changes as the organization and program evolve.

And that is the art and technology of business process mapping at the California High-Speed Rail Authority.

Saturday 14 November 2020

5S as a Tool for Gaining Buy-in

Six Sigma Tutorial and Material, Six Sigma Exam Prep, Six Sigma Learning, Six Sigma Guides

During my experience as a Lean Six Sigma (LSS) practitioner, I have found that it is very important to grab the attention and the interest of participants as quickly as possible. For any Lean program to succeed, participants must immediately identify with and buy into the concepts, and learn how Lean will benefit their lives.

One way to gain this support is to begin a LSS implementation with a 5S event. The 5S idea of sort, straighten, shine, standardize and sustain (or whatever the particular organization’s translation of the five Japanese terms may be) can be used to teach the general Lean concepts of waste reduction to the workforce. It also can be the organization’s best introduction to the LSS  world. I have found that the typical shop floor participant is interested in finding out two things: 1) “Does LSS work?” and 2) “How will it affect me?” A 5S event can address both questions, and thus help to build backing for the program.

Does LSS Work?


On the first day of a 5S event, the team members typically meet for a training presentation to learn about the virtues of Lean. They get an overview of the standard Lean tools, such as value stream mapping and work cell concepts, as well as how 5S works. The use of industry examples in this explanation phase is one way to prove that Lean works.

The logical industry example for a 5S and LSS training session would be Toyota Motor Corp., one of the most recognizable and successful organizations practicing Lean. However, I discovered that when I used Toyota as an example of success, I would begin to lose my audience. The idea of implementing the philosophy of a Japanese mega-manufacturer in a medium-sized Midwestern U.S. equipment manufacturer seemed a near impossibility to the floor associates. To find out how I could better translate the success of Lean concepts and philosophy to a 100-year-old American firm, I researched further into the origins of LSS.

It didn’t take me long to find the perfect example of Lean manufacturing in an equipment application that was more familiar to my students: the Ford Willow Run facility of the early 1940s. Charles Sorensen, the plant’s lead engineer, applied Lean manufacturing techniques to complex machinery, such as Consolidated Aircraft’s B-24 bombers, built under contract by Ford. The effort provides proof that Lean works in a relatively low-volume environment. The classical pre-war method of aircraft production yielded one bomber per day. After applying Sorensen’s basic Lean concepts – building only what is needed, when it is needed – the Willow Run facility produced one bomber per hour. The photo of the Willow Run production lines below demonstrates the use of 5S in American war production plants.

Six Sigma Tutorial and Material, Six Sigma Exam Prep, Six Sigma Learning, Six Sigma Guides
Figure 1: 5S in Practice in 1943 on the Ford Willow Run Production Line

How Will LSS Affect Me?


As the 5S event is underway, it is important to emphasize the fact that 5S is more than simply cleaning up. It puts into practice the Lean philosophy of continuous improvement through the non-stop elimination of waste. Who is better to identify the waste in a particular work center than the people who work in it everyday? The 5S event allows management to illustrate how Lean empowers workers to make positive changes in their work environment.

As part of the 5S event, participants receive training in identifying wastes. They also have the opportunity to apply their education to practical situations. It is crucial for management to allow the event process to evolve as a work center team activity. The team must “do” the event, versus having the event done to them – this will allow them to understand the impact Lean will have on their work.

For example, work center associates must decide which tools and equipment will stay in the work center as part of the Sort step. With minimal guidance from the facilitator, the team must also define the location of the remaining equipment. It is important that the team take ownership of the event. It will succeed or fail based on their decisions and effort.

The Shine portion of the event will most likely uncover a maintenance need. Many times this will require the special skills of the maintenance department. If so, the facilitator should leave it up to the team to schedule the work with the maintenance group. The Standardize segment of the 5S event mandates that rules be established to ensure compliance with the Lean philosophy. Again, this provides the opportunity for work center members to control their environment. The facilitator must allow the team to define the daily and weekly actions that will sustain the 5S gains.

After the event, the team must continue to find opportunities to eliminate waste. The idea of continuous improvement does not stop with the conclusion of the 5S event. The LSS practitioner can challenge the work center team by asking, “How are you going to get better next week?” This can be a natural lead-in to other LSS actions such as total preventive maintenance, quick changeover, kanbans and process monitoring through statistical process control.

Empowered to Make Change


The 5S event provides the opportunity to show the workforce that LSS is not an abstract philosophy invented by mass manufacturers for high-volume production. Its roots lie close to home, and it was applied at a time when more than just profits were at stake.

Lean is a mindset dedicated to the elimination of waste at every level and for operations of any size. The process experts – the people who perform the actions on a daily basis – are tasked with not only identifying, but also eliminating that waste. By giving team members the empowerment to take action, the LSS philosophy can be fostered throughout the organization.

Friday 13 November 2020

Managing Change to a Continuously Improving Culture

Six Sigma Tutorial and Material, Six Sigma Exam Prep, Six Sigma Guides, Six Sigma Prep

When evolving a culture of continuous process improvement using associated methodologies such as Six Sigma or Lean, the ultimate goal is to improve business performance. An important factor is changing the underlying culture of an organization. It is important to define culture in terms of the organization, and to understand its ramifications to the organization. Culture is how an organization classifies, communicates and acts in a given situation. Therefore, effective cultural change is the result of changed norms and beliefs of individuals reinforced by actions supporting the desired change. Linking continuous process improvement to business performance is one of the greatest challenges faced by the organization. Without this linkage, continuous improvement is scatter-shot at best and random at worst.

Making a connection between continuous process improvement and business results can be problematic. There are many reasons including the defense of the status quo, resistance to innovation or fear of reprisal, but a significant reason is that the language of continuous process improvement is not normally the language of business results. For example, terms like “flow day” or “defect rate” Are often unfamiliar. Even more often, one can hear debates over whether an improvement results in cost savings or cost avoidance. Aligning continuous process improvement with the language and direction of an organization’s business results is crucial in shaping an effective improvement culture.

What Should an Organization Do?


Research suggests that in an organization, the personnel typically fall into a normal distribution of attitudes towards continuous process improvement (Figure 1). There are a small number willing to lead change, the adopters, and a small number that actively fight change, the fighters. The balance – a large majority – is in the middle. Normally organizations focus on rewarding the adopters, and discouraging or ignoring the fighters, but since a large majority of people are neutral, logic would dictate a focus on the center. The objective would be to shift the average attitude toward adopter.

Six Sigma Tutorial and Material, Six Sigma Exam Prep, Six Sigma Guides, Six Sigma Prep
Figure 1: Normal Distribution

A culture change acceleration model is useful at this point. The model is split into two categories of actions with three activities each and provides a useful outline for creating a management framework which addresses the entire organization. At the executive level of an organization, the focus, and therefore the management structure, should be on:

Mobilizing acceptance and shifting the neutrals in the direction of the adopters while maintaining the adopter portion of the population.
Sustaining and standardizing business results across the organization.
The specific activities in each of the focus areas are illustrated in Figure 2.

Six Sigma Tutorial and Material, Six Sigma Exam Prep, Six Sigma Guides, Six Sigma Prep
Figure 2: Two-Segment Culture Change Model

How Should an Organization Do It?


Knowing what to do, must be followed by knowing how to do it. The basic steps are somewhat different for each organization based on its maturity and capability. As in many business processes, the steps are a continuum with no clear end or beginning. They are based on the PDCA “Deming Cycle” (plan, do, check, act), and the Six Sigma DMAIC roadmap (Define, Measure, Analyze, Improve, Control). The steps are:

1. Organize planning and implementation teams: At each organizational level a team is sponsored by the senior leader, chaired by one of the senior leader’s staff, and consists of the leaders of the subordinate organization. The role of the senior leader is primarily to “mobilize acceptance,” and the chairman’s is to “implement and sustain improvement.” The distribution of these roles is flexible and can be fluid based on the situation. While going through the organization phase, an organization is likely to uncover problems. These are not new problems, but will need to be effectively resolved in order to keep up continuous process improvement momentum. As the teams are cascaded down through the organization, the teams become less “steering teams,” and more tactically focused “implementation teams.”

A. Steering teams sanction the overall program; set vision, mission and overall goals; communicate to all hands; make policy decisions; approve recommendations; create accountability for lower level teams; assure resource availability, and ensure the results from sub-teams are institutionalized across the enterprise where appropriate.

B. Implementation teams implement continuous process improvement and coordinate results with steering teams. Their main role is to train, equip and enable the discrete process teams, Lean event teams, Six Sigma project teams, etc. They also play a key role in implementing the best practices created by other teams where applicable.

2. Align business goals up and down the organization: This is the process of ensuring the organization and its sub-organizations are all moving in the same direction. Most organizations are fairly good at this. Some names for this activity are Hoshin planning, policy deployment, strategic alignment and deployment or balanced score-carding.

3. Identify measurements (create them if needed): Identify or create consistent measures to track aligned business goals and gauge the effectiveness of the continuous process improvement effort. Spend time on this step. Downstream measurement system changes make it difficult or even impossible to do 1-to-1 comparisons over time.

4. Align continuous process improvement activity (but not too tightly): Use the hierarchal teams to drive accountability to organizational goals. For example, most continuous process improvement teams, projects, etc. need to define, in their business cases, how their activities will improve the aligned business goals, and improve the organization’s metrics. Care should be taken in allowing continuous process improvement to take place in problem areas with weaker correlation to business results such as annoyance areas or high interest areas. Create accountability for results: Follow-up should be rigorously implemented at each team level to ensure the continuous process improvement effort is effective, standardized across the enterprise, and have the desired results in terms of the organization’s metrics.

Continuous process improvement and a culture of proactive change adopters will not come overnight. Management cannot communicate or support too much. Diligence and hard work are required at every level. As with almost anything else, proactive leadership, management and accountability for results are the best tools to ensure success.