Showing posts with label Case Study. Show all posts

Monday, 13 December 2021

Using PRINCE2 at NatureScot Case Study

PRINCE2, PRINCE2 Exam, PRINCE2 Exam Prep, PRINCE2 Certification, PRINCE2 Guides, PRINCE2 Learning, PRINCE2 Career, PRINCE2 Certification, PRINCE2 Case Study, PRINCE2 News

NatureScot is the Scottish Government’s agency for all matters relating to nature, and one of its responsibility’s is to organize Green Infrastructure Strategic Intervention (GISI) projects. This paper explores how PRINCE2 was used to organize the Knowledge Exchange event, which intended to create networking opportunities for those involved in GISI projects.

The paper will also discuss how specific PRINCE2 principles were applied to the project, specifically to unexpected events.

Case Study

1. Introduction

NatureScot is the Scottish Government’s agency for all matters relating to nature. Our website is at Nature. Scot, which also hosts our Green Infrastructure Strategic Intervention (GISI) project pages.

As Green Infrastructure Project & Funding Officer at NatureScot, I am the first point of contact for the following:

◉ Eight construction projects that are creating or improving greenspace and other green infrastructure in areas of multiple deprivation in urban Scotland.
◉ Six community engagement projects.
◉ Communications to encourage the mainstreaming of green infrastructure.

The GISI is a £16 million European Regional Development Fund (ERDF) that NatureScot manages on behalf of the Scottish Government. The 15 capital projects supported by the fund are predominantly managed by local authorities, but three are managed by housing associations, and one by an NHS Board. They fit well within the PRINCE2 definition of a project because they are all temporary and are delivering a specific change in-line with a business case.

The GI Community Engagement Fund is smaller (£0.5 million) and supported 11 applications to increase involvement in greenspace, within areas of multiple deprivation. Nine of these proposals were delivered by charities. These grants did not closely align with the definition of a PRINCE2 project, because they were much more closely linked to business as usual (BAU) for the applicants. The exception was a pilot to work with a discrete community to design and install a ‘raingarden’ to reduce surface water flooding within a small area beside two tower blocks.

2. Background


In Scotland, the mainstreaming of Green Infrastructure (GI) into projects is behind London and mainland Europe, and actors tend to work in isolation, even though they have good links with EU and global networks. In order to address this, one of the objectives of the GISI is to encourage a network of actors in the GI field to reduce siloed working and increase momentum towards mainstreaming GI in Scotland.

Green infrastructure (GI) is the network of multifunctional greenspace and other vegetated features, and is being increasingly recognized as as important as ‘grey infrastructure’ such as roads, sewage networks, etc. GI can address multiple problems faced by society in the face of climate change and biodiversity loss. A well-designed and maintained GI has been proven to improve mental health, help with urban cooling, maintain good air quality, reduce surface water flooding caused by extreme rainfall, and encourage active travel when integrated with active travel networks.

The Knowledge Exchange project was part of a programme to fund GI projects, best called the Green Infrastructure Strategic Intervention (GISI).

Main stages of the GISI Dates 
Test market for grant intervention  Sept 2013 to Dec 2014
Develop fund criteria, processes, and products to secure funding and Lead Partner status  Dec 2014 to July 2015 

DecManage applications and funding for Phase 1 projects and Community Engagement and promote the GISI.

Repeat for Phase 2 projects

July 2015 to June 2023 
Review project and close  June 2023 to Dec 2023 
Table 2.1 Main stages of the GISI

3. Aims and Objectives


The specific aims of the Knowledge Exchange in September 2018 event were to:

◉ Host a GISI stakeholder event at a venue in the Central Belt.

◉ Aim the event at organizations with GI funding, staff from other ERDF Strategic Interventions in Scotland, Scottish green infrastructure network partners, and organizations that are potential applicants in future funding rounds if Phase 2 does happen.

◉ Have an event that is relevant and interesting enough to attract capacity attendance.

◉ Ensure that NatureScot’s profile is prominent at the event and in the communications surrounding it.

◉ Visit one or both sites from Round 1 that are making progress on the ground, or another green infrastructure project.

The event was part of NatureScot’s Sharing Good Practice series and needed to be within the set budget of £2,000.

The long-term goals were to promote more collaborative working or knowledge sharing among actors in the UK GI field, and to influence the Shared Prosperity Fund that was to replace EU Structural Funds post- Brexit.

The benefits resulting from the event will be that the network of organizations delivering and managing green infrastructure will be strengthened. Green infrastructure will have increased further in prominence, as an important part of modern urban planning and management.

4. Approach


A Sharing Good Practice (SGP) event is an opportunity to apply the PRINCE2 principle ‘Learning from Experience’ since projects with grants have valuable knowledge and experience that can help other potential applicants. The presentations at events are valuable, but just as important are the informal networking opportunities, and, ideally, on- site discussions during site visits.

The involvement of speakers with high profiles in the GI field, such as our CEO and staff from the ERDF Directorate that approve our funding, indicated that the success of the event could not be left to chance. During a period of austerity, attendees needed to be sure their time would be worthwhile. Specifying the requirements was one of the first steps:

◉ Each project should be given the chance to present to the audience.
◉ There must be two speakers (keynote and summing up) with UK prominence in the GI field.
◉ The participants should be welcomed to the event by either the Chair or CEO of NatureScot.
◉ The programme needs to have visits to projects.
◉ Sustainable travel must be a reasonable option.
◉ Publicity must credit NatureScot, GI, ERDF and partner organizations.
◉ Catering companies must source food locally when possible.
◉ Any organization involved will expect to see their project credited appropriately.
◉ People attending will provide feedback.
◉ People attending will have real opportunities to share their experience and learn from others attending.

4.1 Description of Planning process

The Sharing Good Practice (SGP) had an established process in place which we used the PRINCE2 method for. After the Knowledge Exchange was accepted, as part of the programme, two members of the SGP team were assigned as contacts, one of whom sat on the project executive as a senior supplier. The second person helped with most of the administrative tasks.

The project board included:

◉ Head of GI Fund team in NatureScot: project executive
◉ Manager of Sharing Good Practice team: senior supplier
◉ Head of Strategy at Central Scotland Green Network Trust: senior supplier
◉ Key contact from one of the Glasgow projects: senior user
◉ Project & Funding Officer: project manager.

Tasks Breakdown of tasks
Planning Organize the programme
Organize catering
Source the venue
Organize speakers, workshop leaders, and facilitators
Review dates to improve attendance, visit potential venues.
Pre-event Publicity and promotion
Practical communications for the event
Draft in support from other parts of NatureScot
Organize any materials needed for workshops, specification, and management of facilitator contract.
On the day Ensure that the equipment is in place Greet attendees
Record the event
Risk assessment for any site visits
Draft tweets and decide on a hashtag search for the event.
Administrative Upload the presentations to the website
Organize expenses payment and accommodation for speakers if needed
Information system security checks for viruses in presentations
Transport and subsistence (T&S) for speakers and workshop leaders
Book coach transport.
Project management Produce the project brief
Complete the business case (online database form)
Maintain the daily log
Assemble the project initiation documentation (PID)
Manage the budget for the project
Manage the timeline
Deal with risks and issues arising
Record lessons to be learned
Write the closure report.
Table 4.1 Breakdown of tasks

As an organization, we have existing tools to record and plan details of a project. Existing templates from Sharing Good Practice include: a planning timetable, tested programme timings, event checklist, and expenses forms. There is also a task list template available within NatureScot. In addition, we used the PRINCE2 Handbook to refer to best practice methods.

5. Challenges


We faced a few challenges during the lifecycle of the project. Some of these were minor, handled in passing, and possibly unique to this project. Others are possible issues for future events and were included in the lessons report. The venue change and cost increase triggered a management by exception event and was escalated to the project executive. Once again, the PRINCE2 method facilitated solutions.

Challenge Solution 
The original venue withdrew from the contract three months before the event, and a few days before we were due to distribute the flyers about how to get to the event, etc. The information from the original venue search was still available, meaning a replacement was quickly found.
A TV news programme wanted to interview key
personnel during the day, and with very little notice.
The communications person had not been given
clear boundaries 
The team was briefed, so the project manager could advise on the interview without too much disruption.
The Head of GI was able to do the interview. 
The air conditioning was noisy and needed to be switched off by one of the venue team.  Identifying team members to deal with unforeseen
problems on the day was a good idea. 
A field visit leader was ill on the day.   A community member willingly stepped in on the day as a replacement because the project had high community buy-in. 
The change in venue resulted in an increase of £600 to the overall budget.  The project risk thresholds resulted in the increased cost being promptly handled via the appropriate route, which gave greater confidence to the decision-maker. The previous recording of venues as a saved project document made deciding a replacement faster. 
Table 5.1 Challenges and solutions

6. Successes


The event featured on the regional TV news, which exceeded expectations. Organizations that were interested in applying for Phase 2 of funding attended and were inspired to apply. The event enabled networking that led to better quality applications. The GISI is agreeing contracts with Phase 2 projects, some of which may be showcased at the UN Climate Conference in Glasgow in November 2021.

Existing projects realized that they were part of a larger trend, which is likely to continue well beyond the lifetime of the GISI. The community food growing projects were inspired to increase efforts toward a Glasgow-wide network of community food organizations.

Taking a risk by including a facilitated session on the performance of the GI Team provided constructive feedback. Recommendations were included in NatureScot’s response to the Scottish Government’s consultation on the Shared Prosperity Fund, the replacement for European Structural Funds. The facilitated session also made explicit how the GI Team had improved by understanding that change is very common in project management, and endorsed our problem solving and project management focus.

The most serious challenge to the project was the booked venue withdrawing its availability, because of change to its charitable objectives. The clear definitions of project organization and management by exception in the PRINCE2 manual expressed that I did not have to make decisions alone. We had a strong ‘focus on products’, which was crucial when the original venue cancelled. The product description for the venue and recording of results from the initial search made choosing a replacement simpler and faster. It is possible that without these two documents, the event would have been cancelled.

The lessons report has led to changes in how projects that may attract media attention interact with our communications team. The communications personnel are giving clearer boundaries on what to expect on the day, and ways of further delegating tasks on the day allows the project manager to take part in interviews more flexibly.

We were in the right position to be able to realize the benefits of the project outcome:

◉ The attendees are better connected, resulting in a network of community food growing projects.

◉ The benefits were as described in the project brief and business case in the Sharing Good Practice database, but the publicity exceeded expectations.

◉ The biggest contributor to success was the project brief (derived from AXELOS) in setting limits on the scope of the project, emphasizing the importance of learning from previous projects, and recording results.

◉ We had thought to organize a similar event for the Community Engagement projects. However, a review of the lessons report concluded that the potential risk regarding management of grant claims was too great to organize, without the support of the SGP team, which had been abandoned.

Source: axelos.com

Monday, 19 October 2020

Case Study: Streamlining Coast Guard’s Accounts Payable Process

Case Study, Six Sigma Learning, Six Sigma Certification, Six Sigma Prep, Six Sigma Study Materials 

The local senior leadership of the U.S. Coast Guard Finance Center was confronted by the problem of maintaining high levels of service in its accounts payable (AP) process in the face of increasing process complexity. Compounding the issue was the fact that the center’s information technology (IT) systems had been modified to accommodate the growing complexity without a comprehensive business process review, which in turn added even more complexity, resulting in a vicious and endless cycle.

The center, located in Chesapeake, Virginia, employed approximately 360 full-time federal employees and 180 contractors who provided a range of accounting transactional processing and financial statement preparation services for the Department of Homeland Security (DHS), Coast Guard and Transportation Security Administration (TSA). Beginning in October 2006, the center commenced full accounting services for the Domestic Nuclear Detection Office. It also operated and maintained the financial system and associated data bases for some components of DHS. The center processed approximately 2.5 million transactions annually.

Overcoming Process Complexity


An area of particular concern for the local senior leadership was the accounts payable process supporting TSA. It wanted this process to be world class and become the standard process for all their accounts payable services. The finance center leadership was convinced the process used the correct basic financial system tools and architecture for long-term sustainability, but the complexity of this process had grown since its inception of just two short years before. This complexity (Figure 1) over-stressed people, processes and systems with re-work loops, delays, errors, penalties, duplicate payments and more. The center was in a bind, and bringing in additional resources was not an acceptable option.

Case Study, Six Sigma Learning, Six Sigma Certification, Six Sigma Prep, Six Sigma Study Materials

Figure 1: U.S. Coast Guard Finance Center Current-State Accounts Payable Value Stream Map

But the center’s senior leadership had a strategy for success: Bring in an experienced Lean Six Sigma consultant with a finance background to lead the project team, break through the complexity, and design a Lean, effective and scalable process.

Project Starts with a Value Stream Map


Where did the project team start? It began with a value stream map, then it identified where the non-value-added time was spent. Next, the team developed a measurement system so that it could determine how much time was spent in these non-value-added areas. In addition, the team began to measure queue volumes by specific activities over time within the process. For example, during the initial analysis, the team determined from the Define and Measure phases of a DMAIC (Define, Measure, Analysis, Improve, Control) project:

◉ Current process cycle efficiency is less than 1 percent
◉ Current lead time is 14 days
◉ Sigma level = 1

Some tough questions were asked and that forced many process owners and stakeholders to re-think why they were doing things the way they were. Finally, the project team measured the voice of the customer by conducting a phone survey with their TSA customers. Many Lean Six Sigma tools, such as process mapping, cause-and-effect analysis, failure mode and effects analysis, and basic statistical analysis, were used. In addition, two Kaizen events were conducted. This resulted in some quick wins.

One of the Kaizen events, in particular, produced tremendous results in the authorized certifying officer (ACO) invoice approval queue. This queue contains invoices that had already been entered into the system, and were approved by the contracting officer and his or her technical officer. The ACO invoice approval is the final step in the center’s payment approval process before the invoice is submitted to the U.S. Treasury for payment.

Fixing the ACO Queue Problem


This specific ACO queue was identified through the value stream mapping exercise as a constraint in the process due to the high level of items in the queue (an average of 175 invoices daily with spikes to nearly 700 at times). When the level of invoices spiked, overtime was required to process them. In one Kaizen event, code-named “Queue Blitz,” the ACOs did nothing other than review and approve invoices. After 10 days with intense focus, the queue reached an all time low of one invoice in the queue. That was almost a 100 percent reduction in work in progress (WIP) as shown in Figure 2.

Case Study, Six Sigma Learning, Six Sigma Certification, Six Sigma Prep, Six Sigma Study Materials

Figure 2: Authorized Certifying Officer Queue

The next step was to maintain an acceptable level of WIP, and institutionalize this as a daily goal. The team determined that one day of WIP would equate to 80 invoices in the queue. (This was based on four ACOs reviewing and approving 20 invoices a day in addition to their other duties.) The finance center management teams are currently using control charts to manage the WIP to no more than 80 invoices a day with a stretch goal of 50. With this revised process, the level has never exceeded 83, resulting in little need for overtime and a reduction in interest and late penalties.

More Plans for the Future


This effort has begun to “turn the ship around,” but there is more ground to cover to get to a world class process. By utilizing the Lean Six Sigma methodology, the finance center now better understands where the pain lies (the root cause) and has already started developing improvement plans aimed at reducing the complexity and streamlining the larger process. The team identified process and management improvements that could be implemented quickly and expected to be completed with the Improve phase by the second quarter of fiscal 2007. After the process changes were implemented, the team defined areas requiring software changes or the use of new software tools, defining the requirements and performance outcomes for these software changes that will be given a high priority for completion and implementation

Wednesday, 7 October 2020

Case Study: Improving Purchase Order Process

The accounts payable shared services center (SSC) of a large Ohio-based healthcare system completed a Six Sigma operational enhancement and reporting project. This case study reviews the course of the project which endeavored to establish standard invoice processing times and develop an ongoing system for monitoring how well those standards are met.

Over the last three years, the SSC processed an average of 738,000 invoices a year for payment. The largest segment of its operations was, and continues to be, purchase order (PO)-based invoices. In 2013, PO invoices accounted for 56 percent of the total processing volume for the SSC.

As a means to help address the high volume of PO invoices being processed, the SSC established a daily production quota. The apportionment was determined by taking the estimated total number of PO invoices to be processed in a given month divided by the number of working days within that month. This number was then divided by the number of assigned employees. The formula used to calculate the quota was a frequent complaint of SSC employees and supervisory staff because it failed to recognize the variability in processing time when multiple line items were present on a PO invoice.

Project Objectives

Amid calls for change, the SSC embarked on a Six Sigma project in mid-2013 that contained three objectives.

1. Establish a standard time range for completion based upon the total number of line items on a PO invoice.

2. Determine the process time for an invoice and whether that time fell below, within or above an established standard time range (also based upon the number of line items on each PO invoice).

3. Develop a comprehensive operations report that displayed employee processing times measured against standard time ranges.

Database Evaluation

Within days of the project’s kick-off, the systems analyst for the SSC evaluated the accounts payable application used with PO invoices. The findings revealed the application’s database design was unable to separate PO invoices by total number of line items or to capture the total processing time expended by the employees who worked on the invoices. Discussions between the SSC project team and the developers of the application led to the conclusion that the best long-term solution was to make modifications to the database. Outside developers were contracted, and the database was modified to pull in all necessary data and make it readily accessible.

Data Analysis

Fourth quarter 2013 data was exported from the database into Microsoft Excel by structured query language (SQL) code written into Microsoft Access. The exported data, referred to as raw data by the project team, was presented in three columns. These columns contained the name of the employee, the total number of line items, and total time, in seconds, for each PO invoice processed. The project team copied the content of the columns into Minitab to perform data analysis. Despite being confident that the transactional raw data possessed a non-normal distribution, the project team performed a graphical summary on the response variable, processing time.

Six Sigma Tutorial and Material, Six Sigma Learning, Six Sigma Certification, Six Sigma Exam Prep

Figure 1: Summary of Processing Time, Q4 2013

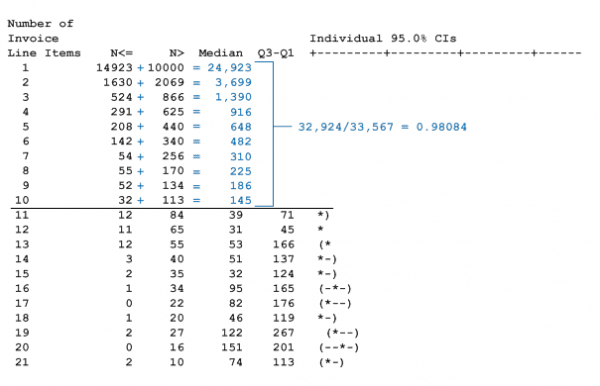
The Anderson-Darling statistic, with its p-value being lower than the chosen significance level of 0.05, confirmed the assumption that the data did not follow a normal distribution. This cued the project team to evaluate various nonparametric tests and determine which of these tests were the most appropriate going forward. An important factor in this decision was the wide variance in processing times. The graphical summary displayed a range of 3 seconds to 3,875 seconds. The project team needed a nonparametric test that was effective against outliers and errors in data. After a thorough review, the decision was made to use the Mood’s Median Test.

With the nonparametric test selection now behind them, the project team focused its attention on acquiring an accurate understanding of the effect the total number of line items had on actual processing time of a PO invoice. Again using the fourth quarter 2013 raw data, the project team carried out a Mood’s Median Test. The outcome of the test revealed that the 33,567 PO invoices consisted of 77 separate groups of invoices possessing the same number of line items. Further, the project team found that 33,924, or 98 percent, of the PO invoices encompassed the first ten invoice groups.

Six Sigma Tutorial and Material, Six Sigma Learning, Six Sigma Certification, Six Sigma Exam Prep

Figure 2: Number of Line Items Per PO Invoice

Due to the high percentage of invoices in those first ten invoice groups, SSC management decided that standard time ranges would include only those first ten groups. The project team next needed a statistical tool to help identify the standard range of processing times specific to each invoice group. Because of the ability to provide an upper and lower bound, the confidence interval was the instrument of choice. Obtaining a useful confidence interval within Minitab’s available nonparametric tools, however, gave the project team an additional challenge. While the Mood’s Median Test produced the required median information for each invoice group, the corresponding confidence interval failed to provide a usable range as it does not include lower and upper bounds.

Six Sigma Tutorial and Material, Six Sigma Learning, Six Sigma Certification, Six Sigma Exam Prep

Figure 3: Standard Processing Times – 1

The solution was Minitab’s bootstrap macro. The macro calculates nonparametric confidence intervals by using bootstrap methods code, which is a statistical technique used for making certain kinds of statistical inferences and involves a relatively simple procedure repeated so many times that the technique is heavily dependent upon computer calculations. To apply the macro, the project team had to identify input data, the number of iterations to be used in estimating a confidence interval and the significance level. With processing time as the input data, iteration volume at 1,000 and a significance level of 0.05, the bootstrap macro was performed on the first invoice group – PO invoices with one line item.

Six Sigma Tutorial and Material, Six Sigma Learning, Six Sigma Certification, Six Sigma Exam Prep

Figure 4: Bootstrap Macro – 1

With 24,923 data points, the bootstrap macro was unable to provide any separation between the upper and lower bounds. To address this issue, the project team had to reduce the volume of data points being calculated. This was accomplished in a two-step process:

1. Calculate an appropriate sample size. The data point figure of 24,923, substituting as a population number, was input into an online sample size calculator. The result was a sample size of 378.

2. Randomly select and segregate 378 of the first invoice group’s processing times. To achieve this function Microsoft’s Random Sampler was employed. The project team subsequently copied the 378 processing times into Minitab and re-performed the bootstrap macro.

Six Sigma Tutorial and Material, Six Sigma Learning, Six Sigma Certification, Six Sigma Exam Prep

Figure 5: Bootstrap Macro – 2

The bootstrap macro was utilized on the remaining nine invoice groups. To further broaden the distance of upper and lower bounds for invoice groups 2 through 4, the project team again used the same two-step process.

Six Sigma Tutorial and Material, Six Sigma Learning, Six Sigma Certification, Six Sigma Exam Prep

Figure 6: Standard Processing Times – 2

At the end of this analysis, a standard processing time range for each distinct invoice group had been successfully constructed. This meant that the project team had realized the first of the project’s three goals (establish a standard time range for completion based upon a PO invoice’s total number of line items).

The remaining two objectives – the ability to determine an employee’s elapsed processing time and whether that time fell below, within or above an established standard time range and the development of an all-inclusive operations report – were determined to be mutually dependent. This conclusion guided the project team to seek added assistance from the systems analyst.

Developing a Time Analysis Report


As discussions began, the project team laid out the requirements for a time analysis report. The contents of the report needed to include the standard time ranges by invoice group, including median numbers, names of employees, median processing time of each employee by invoice group, and a color scheme applied to an employee’s processing time when compared to the standard time range. In addition, the project team wanted the user of the report to be able to designate a date range and either run the report or export the raw data into Microsoft Excel. The conversations that followed contained debate over content, format, coding, application strengths and weaknesses, and completion date. In the end, agreements were reached and the development of the report started.

In order to meet the needs of the time analysis report, the systems analyst built not only the report but also a command menu page to accommodate the functionality. An extended review of the relationships between the deliverables influenced the decision to first build the command menu page. Using SQL and visual basic for applications (VBA) coding within Microsoft Access and SQL server software, the command menu page was built.

Six Sigma Tutorial and Material, Six Sigma Learning, Six Sigma Certification, Six Sigma Exam Prep

Figure 7: Command Menu Page

To create the time analysis report, the systems analyst used the same coding and software tools used to produce the command menu page. Due to the report’s complexity, however, a custom module using VBA coding was developed and a conditional report formatting instituted. Lastly, links between the command menu page and the time analysis report were created.

With the time analysis report fully functional, the project team ran the report to acquire fourth quarter 2013 baseline performance figures.

Pilot


Six Sigma Tutorial and Material, Six Sigma Learning, Six Sigma Certification, Six Sigma Exam Prep

Figure 8: Baseline Figures

The project team met with the SSC employees to present the report and baseline numbers. A four-week pilot tested the internal theory that employees whose performance results are openly and routinely shared among members of their work group (as an application of a Lean visual office) strive harder to meet or exceed current operational standards. The feedback from employees was predictable – those employees meeting or exceeding standards had no concerns with the sharing of information while those who found themselves failing to meet the standards were not entirely enthusiastic about the idea. What ultimately sold the concept to all associates was that everyone’s performance was being shared. Additionally, improved employee efficiency would be reflected in the raw data when standard processing time ranges were recalculated. This would then generate a positive downward trend in processing times. Throughout the duration of the pilot, a time analysis report was produced weekly and distributed by email.

Results


While pilot outcomes showed a measurable improvement in productivity, the pilot revealed that employee motivation was not solely responsible for the gained efficiencies. Employees who found themselves struggling to meet the standard processing time ranges sought and received coaching from supervisory staff. The extent to which the supplemental instruction influenced the conclusion of the pilot could not be determined. An unexpected discovery was the fact that the employees lacked a knowledge of the tasks required to correctly process PO invoices. Regardless, the pilot was jointly deemed an overall success by the project team and management.

Following the pilot and its disclosures, the SSC assembled and conducted a series of employee retraining sessions aimed specifically to address trouble areas. Operational policies were updated to prevent possible processing time manipulation. New standard processing time ranges, based upon pilot data, were set in place. Employees continued to receive the time analysis report weekly and their capacity to meet PO invoice processing requirements was tied to bi-annual and annual appraisals. On the whole, the SSC creatively overcame every obstacle encountered and intends to aggressively employ this successful methodology on all future projects.

Monday, 5 October 2020

Case Study: Reducing Delays in the Cardiac Cath Lab

Six Sigma Study Material, Six Sigma Learning, Six Sigma Certification, Six Sigma Exam Prep

Cardiac catherization labs represent a significant capital investment for many hospitals. Realizing a return on this investment is increasingly challenging, given the introduction of advanced technologies and limitations in reimbursement. To meet the challenges and maintain fiscal health, hospitals pursue Six Sigma, Lean and change management techniques to improve throughput, maximize equipment utilization and increase efficiency.

New York-Presbyterian Hospital embarked on a comprehensive initiative aimed at improving throughput in the cardiac catherization labs at the Columbia University Medical Center, New York Weill Cornell Medical Center and Children’s Hospital of New York-Presbyterian sites.

The improvement initiatives at New York-Presbyterian focused on the various sub-cycle times impacting throughput – including case start time, room turnaround time and patient prep time. As a result of these multiple projects, the hospital gained 312 hours of procedure time without incurring any additional capital expense. An overview of one project conducted at Children’s Hospital of New York demonstrates how the Six Sigma DMAIC (Define, Measure, Analyze, Improve, Control) methodology provided the framework and tools to raise departmental productivity by improving first case start times.

The Define Phase


Improving first case start time was selected as a project by the Children’s Hospital of New York for several reasons. It contributed to a significant amount of lost productivity and failure of the first case to start on time was delaying subsequently scheduled cases. This variability in start time and lack of schedule predictability also was contributing to staff, physician and patient dissatisfaction.

A charter was developed and approved by senior leadership and a team assembled to lead the initiative. The charter provided:

  • Project Scope – This established the parameters for the project. The start point of the cycle was patient’s arrival at the hospital and the end point of the patient’s entrance into the cath lab. The charter also described areas outside of the team’s scope, such as room turnaround time, which was the focus of another team.
  • Business Case and Problem Statement – Baseline data indicated that 62 percent of the first cases were not starting on time representing 267 hours of lost staff productivity and unused procedure capacity annually.
  • Goal Statement – A goal of 80 percent on-time starts was established.
  • Team Members – The team for the project included the cath lab director, staff, cardiologists and anesthesiologists. The vice president of operations served as project sponsor and oversaw the work of the team.
  • Timeline – A timeline including frequency of meetings, dates and times was agreed upon at the team’s first meeting and proved essential to keeping the project on track.

The project charter provided the team with focus and direction. The team then developed a map describing the current process.

Six Sigma Study Material, Six Sigma Learning, Six Sigma Certification, Six Sigma Exam Prep

Figure 1: High-Level First Case Start Process Map (Source: GE Healthcare and New York-Presbyterian Hospital)

Completion of the process flow map pointed to one opportunity for immediate improvement – streamlining the nursing assessment. One of the department’s nurses routinely calls patients the night before to reinforce pre-procedure instructions. Discussion during the process flow mapping exercise revealed some redundancy in the information gathered during this phone call and the nursing assessment completed the day of the procedure. The team agreed that initiating the nursing assessment during this phone call would eliminate duplicate data collection, and shorten the time needed to complete the assessment the day of the procedure.

The Measure Phase


The team used brainstorming and a fishbone diagram to identify all the potential contributors to delaying the start of the first case. Some of the factors identified included:

◉ Patient arriving on time
◉ Registration process
◉ Transportation
◉ Timeliness of patient prep
◉ Completion of assessments by the cardiologist, anesthesiologist and nursing

Six Sigma Study Material, Six Sigma Learning, Six Sigma Certification, Six Sigma Exam Prep

Figure 2: Brainstorming and Prioritizing Critical Xs (Source: GE Healthcare and New York-Presbyterian Hospital)

Data was then collected to identify those factors having the most significant impact on delaying the start of the first case.

The Analyze Phase


Regression analysis, a statistical tool used to model and predict the relationship between variables, revealed that the time in which the cardiology assessment was completed was a key driver in whether the first case would be completed on time. The R-sq adjusted value showed that it accounted for about 60 percent of the variation in the process. Here is a table showing the first case start data’s statistical analysis:

X Test  Results Statistically Significant? 
Nurse Test for Equal Variances p=.725 No
Nurse  Moods Median   p=.583  No 
Nurse  Regression  p=.762  No 
Latest Assessment Time   Moods Median   p=.432  No 
Latest Assessment Time   Test for Equal Variances   p=.132  No 
Latest Assessment Time   Regression  p=.177  No 
Anesthesia Yes/No   Moods Median   p=.710  No 
Anesthesia Yes/No   Test for Equal Variances   p=.318  No 
Oral Pre-Med Yes/No   Test for Equal Variances   p=.981  No 
Oral Pre-Med Yes/No   Moods Median   p=.288  No 
Anesthesiologist  Moods Median   p=.389  No 
Anesthesiologist  Test for Equal Variances   p=.013  Yes 
Anesthesiologist  Regression  p=.625  No 
Patient Arrival   Test for Equal Variances   p=.909  No 
Patient Arrival   Moods Median   p=.615  No 
Difference vs. Card Assessment   Regression   p=.042  Yes
Time Patient on Table vs. Card Assessment   Regression   p=0.00  Yes 
Difference vs. Anesthesia Yes/No   Regression   p=.532  No 
Difference vs. Nursing Assessment   Regression   p=.658  No 
Source: GE Healthcare and New York-Presbyterian Hospital

The Improve Phase


The team used this information to discuss and develop plans to ensure the cardiology assessment could be completed in a timelier manner. For example, since the cardiology fellow typically initiates the cardiology assessment, the director of cardiology explored other responsibilities and obligations that might be interfering with timely completion of the assessment. As part of developing a revised process, the team also completed a new process flow map indicating a target completion time for each step in the process that ultimately would lead to the desired case start time.

As shown in the table below, re-measurement of the process indicated a dramatic improvement in the number of first cases starting on time and a reduction in variation.

Data Categories Baseline Data   Improve/Control Data 
On-Time First Case Start 38 Percent 83 Percent
Baseline Z   1.44  2.47 
Median  13 Minutes   0 Minutes 
Mean  38.24 Minutes   6.33 Minutes
Standard Deviation   55.62 Minutes   22.4 Minutes 

The Control Phase


Process control mechanisms were implemented to ensure the changes could be sustained, and that the gains achieved from improvement activities would not be lost over time. The control plan outlined the procedure for monitoring the critical X (completion of cardiology assessment) as well as the number of on-time first case starts. Regular reporting to the project’s executive sponsor reinforced the importance of the initiative and insured that changes would become imbedded into the organization’s culture.

Monday, 28 September 2020

Case Study: Streamlining a Hiring Process

Six Sigma Exam Prep, Six Sigma Learning, Six Sigma Certification, Six Sigma Learning, Six Sigma Prep

A Lean Six Sigma (LSS) team leveraged its acumen in process improvement and operational excellence to overhaul an organization’s human resources (HR) talent acquisition (TA) operation. By coupling fundamental LSS tools like fishbone diagrams, value stream maps and cause-and-effect matrices with Lean concepts like visual management, the team was able to identify areas for improvement and implement sustainable countermeasures for the TA department. By the end of the project, the overhaul had saved the organization more than $165,000. More, the project transformed the TA department from business line “order takers” into a troupe of trusted, efficient and tactful human resource leaders.

Background


The need to update the hiring process came on the heels of an organizational restructuring The HR department had pivoted from a geographically oriented structure to a competency-specific structure. In the previous structure, the client used HR generalists who handled all the HR duties in a particular region (i.e., talent acquisition, employee relations, benefits administration, etc.).

The new model was selected to bring together each HR competency into its own center of excellence. This was done anticipating that increased specialization would generate improvements in effectiveness and efficiency. Once this was complete, the TA department determined it needed further expertise in process improvement and operational excellence to realize these aspirations of increased department efficiencies.

The Current State


The project to revamp hiring began about 90 days after the restructuring had been completed. The first step was to assess the current state of the TA department. Nine recruiters were interviewed about the processes in use to recruit talent across multiple business lines. Concurrent to these interviews and with the participation of these front-line leaders, the project team created value stream maps for each recruiting process in use (Figure 1). Immediately, it was revealed that there was no standard process the recruiters were following to recruit candidates to the organization. After the initial mapping, the same nine recruiters were engaged to identify possible roadblocks in each step of their processes. Together, the recruiters identified 48 obstacles that specifically posed challenges to how they recruit. These obstacles ranged from how they contact candidates for phone screens to the vendor they use as a background check.

Six Sigma Exam Prep, Six Sigma Learning, Six Sigma Certification, Six Sigma Learning, Six Sigma Prep

Figure 1: Value Stream Map of Recruiting Process (Click to Enlarge)

The interviews allowed the recruiters to share best practices between business lines and help newer recruiters navigate the organizational machinery they had not yet figured out. The conversations between recruiters also served to illuminate how the team truly operated. Oftentimes this did not correspond to the recruiters’ intuition. These conversations eventually led to a consolidation of recruiting processes and adoption of best practices for all recruiters. Figure 2 shows one “bone” of a fishbone diagram; each process step had its own bone.

Six Sigma Exam Prep, Six Sigma Learning, Six Sigma Certification, Six Sigma Learning, Six Sigma Prep

Figure 2: Piece of Fishbone Diagram

Objectives


After the current state of operations in TA was mapped, the next step was to identify what was most important to the center of excellence and their stakeholders. Next, the recruiting management team was guided through a brainstorming session. The end goal? Identify how each of the 48 roadblocks identified by the recruiters would affect the performance of the department.

A critical first step in this process was to identify criteria that could be used to evaluate the potential impact of each roadblock. The three most important criteria the team identified were:

1. Time to fill (synonymous with a manufacturer’s lead time)
2. How much time a recruiter spent
3. The quality of candidates

The LSS team facilitated the discussion with the TA management team to evaluate each of the 48 roadblocks based on the selected criteria. A cause-and-effect matrix (Figure 3) helped the team identify the most impactful parts of the overall recruiting process.

Six Sigma Exam Prep, Six Sigma Learning, Six Sigma Certification, Six Sigma Learning, Six Sigma Prep

Figure 3: More Brainstorming with Cause-and-Effect Matrix

Countermeasures


With opportunities and priorities firmly in hand, the next step was to create actionable countermeasures – that is, solutions to the roadblocks –  that would drive the TA team to meet their goals.

Using a countermeasure priority matrix, the project team grouped the evaluated roadblocks into four quadrants across two factors (high/low effort) and (high/low impact) as shown in Figure 4. The team identified the roadblocks that were most critical. Once plotted, the countermeasure priority matrix allowed the formulation and prioritization of action items that aligned with the established goals. Then countermeasures were created. Each countermeasure clearly defined what was to be done, who was to do it and when it was to be done by (Figure 5).

Six Sigma Exam Prep, Six Sigma Learning, Six Sigma Certification, Six Sigma Learning, Six Sigma Prep

Figure 4: Priority Matrix

Six Sigma Exam Prep, Six Sigma Learning, Six Sigma Certification, Six Sigma Learning, Six Sigma Prep

Figure 5: Countermeasures Mapped to Priority Matrix

The team then participated in (another!) brainstorming activity to identify waste in their current processes. The waste identified were steps in the process that added little to no value, but had significant impact on the departmental objectives (Figure 6). In one such example, a recruiter was identified who would reach out to candidates by telephone much more frequently than other recruiters. Because this behavior had a large impact on the recruiter’s time and did not reduce time to fill or improve the quality of the candidate, this was determined to be non-value added and was removed from the recruiter’s value stream.

Six Sigma Exam Prep, Six Sigma Learning, Six Sigma Certification, Six Sigma Learning, Six Sigma Prep

Figure 6: Itemized Implementation Plan for Countermeasures (Click to Enlarge)

Visual Management


Throughout the project, it became clear that in addition to an overhaul of the candidate hiring process, there needed to be a better way for the management team to understand the current state of the department, notice trends and make informed decisions quickly. Additionally, due to recent poor performance, the TA team had to earn back the trust of their colleagues from other business lines.

Early in the project, a strategy was devised to help these managers communicate their successes, make informed decisions and build trust across the enterprise. These ends were accomplished by making use of data already available. (See Figures 7 and 8.)

The LSS practitioners created a suite of management tools that focused on summarizing the health of the department and communicating their efforts to business line customers. One such tool in the suite was the recruiter funnel dashboard (Figure 9). This tool, built entirely in Excel, allowed the recruiting team to illustrate the recruiting activity in each business line by state and provided a quick view of why candidates were not moved forward.

Six Sigma Exam Prep, Six Sigma Learning, Six Sigma Certification, Six Sigma Learning, Six Sigma Prep

Figure 7: High-Level Dashboard (Click to Enlarge)

Six Sigma Exam Prep, Six Sigma Learning, Six Sigma Certification, Six Sigma Learning, Six Sigma Prep

Figure 8: Dashboard for Recruiting Managers (Click to Enlarge)

Six Sigma Exam Prep, Six Sigma Learning, Six Sigma Certification, Six Sigma Learning, Six Sigma Prep

Figure 9: Recruiting Funnel (Click to Enlarge)

Results


Time to fill an open position was one of the most important metrics identified. By the end of the 90-day project, the time to fill metric was reduced by 11 percent. Figure 10’s red box demonstrates that the new process is more capable of hitting the expected time to fill a position. An analysis of variance (ANOVA) test was conducted to confirm that this reduction was statistically significant. (See Figure 11.) The two groups compared in the ANOVA test were requisitions filled up to 180 days prior to the project’s inception and subsequent requisitions filled within 180 days after the completion of the project. This reduction resulted in a cost avoidance savings of over $165,000, mainly achieved through a computed cost of vacancy.

Six Sigma Exam Prep, Six Sigma Learning, Six Sigma Certification, Six Sigma Learning, Six Sigma Prep

Figure 10: Box Plot of Improvements

Six Sigma Exam Prep, Six Sigma Learning, Six Sigma Certification, Six Sigma Learning, Six Sigma Prep

Figure 11: Before/After ANOVA Output

Perhaps more important than the reduction of the mean time to fill an open position, a decrease in the time to fill variance was observed. Using an F-test for equality of standard deviation with the same two groups mentioned above, a statistically significant reduction in the time to fill variation was observed (Figure 12). This had an incredible impact on the trust and confidence business lines had in the TA department. Now, the TA department is more capable of consistently hiring a candidate within a set window of time.

Six Sigma Exam Prep, Six Sigma Learning, Six Sigma Certification, Six Sigma Learning, Six Sigma Prep

Figure 12: Before/After F-test for Variance Output

The tools and data-driven management style that materialized from this project has revolutionized the way the TA team manages and communicates. Upon following up with the management team, they estimate they spend an average of four hours every day working with the tools that were provided to them – roughly 2,000 hours a year.

Along with the concrete results above, the organization has benefited in other, less tangible but highly impactful, ways. TA discussions now revolve around real, objective facts that have bolstered business line confidence in the recruiting team’s ability to meet hiring demands. Additionally, the lessons learned from participating in this project have shifted the culture; the team no longer fights daily fires, but is deliberate and tactical in how they approach each new challenge.

Wednesday, 26 August 2020

Case Study: Salvaging a Call Center’s Big Software Investment

Six Sigma Study Materials, Six Sigma Certification, Six Sigma Learning, Six Sigma Prep

The sales pitch for a new tracking software sounded perfect to the management of an internal call center for a mid-sized financial institution. The call center handled technical problems and policy issues for branch offices across the country – though it was not doing a very good job at either, judging by the increased complaints and staff hours. The new software, the provider promised, would repay the $500,000 investment within six months to a year by reducing complaints, shortening the time it took to answer calls and eliminating the need for some staff positions.

So the company bought the software, had it installed, taught people how to use it. Then the company waited for the results to show up on the balance sheet. Trouble was, months went by and costs in the center remained high. Counting the half million dollar investment in software, the center was significantly over budget, and the senior manager was still getting complaints about poor service. For example, it was common practice among branch employees that if they did not get a clear answer or if the call center staffer sounded confused, they would just hang up. Then they would immediately call back so they would get routed to a different call center staffer who almost certainly would give them a different answer. This was a clear indication of inconsistent service quality as well as artificial call volumes.

The company decided to use the Six Sigma DMAIC (Define, Measure, Analyze, Improve, Control) methodology to resolve the problem.

The Define Phase


The senior manager decided to commission a team to study and improve the problem. The team’s goals were to (a) reduce the average handling time, (b) reduce the number of unnecessary calls and (c) achieve better consistency in answers given to the branches. The desired financial return was minimally to recoup the $400,000 to $500,000 it cost to install and implement the new software.

The Measure Phase


Though the new software program had not yet delivered the promised results, the team discovered that it did have several key features:

1. It tracked the duration of every call: That meant the team was able to gather data to establish baselines and judge whether any changes had the desired impact. Creating control charts of average handling time (AHT) for policy and procedure (P&P) calls and for system support (SS) calls allowed the team to evaluate process capability. The members found that both measures were significantly over the targets.

Six Sigma Study Materials, Six Sigma Certification, Six Sigma Learning, Six Sigma Prep

Figure 1: Policy & Procedures (P&P)

Six Sigma Study Materials, Six Sigma Certification, Six Sigma Learning, Six Sigma Prep

Figure 2: System Support (SS)

2. It allowed calls to be coded according to the type of question: This made it possible for the team to pinpoint the types of problems that generate the most calls and focus on reducing those calls first – a Pareto approach. Unfortunately, the team found when it began the call center project that about 40 to 50 percent of the calls were being coded as “unknown.”

The Analyze Phase


The team immediately realized that having a high level of calls being coded as “unknown” was trouble. It was impossible to find solutions to a problem that was “unknown.” So the team launched its Analyze work by digging into the reasons why the “unknown” category was used so often. Many of the call center staff used the “unknown” category as a workaround to avoid procedures they did not understand or that contradicted what they felt was the best way to handle an issue. Tagging a call as “unknown” allowed call center staffers the freedom to more or less do whatever they wanted to do.

Immediate steps were taken to improve the use of the software package. The team charted the number of “unknown” calls on an eight-foot-high board installed at the entry of the office building. Having a simple visual signpost helped raise awareness of the importance of reducing the number of “unknown” calls.

The team also discovered that few people referred to the operating manual for the software because it was an enormous, unwieldy binder.

Six Sigma Study Materials, Six Sigma Certification, Six Sigma Learning, Six Sigma Prep

Figure 3: Average Handling Time (AHT) Versus Percent “Unknown” Calls

Another related line of investigation compared the average handling time to the number of “unknown” calls. In Figure 3, the project team stratified this data by color coding it according to the work groups of the individual call handler. There was no clear pattern in the data, but this analysis did allow the team to recognize the call handlers with both low average handling time and low “unknown” figures as top performers. The importance of this became evident in the Improve phase. The team also created a similar chart that displayed how much handling time was spent on the different types of calls. That allowed the team to find the critical few types of questions that took the most time.

The Improve Phase


The project team launched two efforts to help reduce the number of “unknown” calls and improve call consistency:

◉ Three of the top performers who had the lowest number of “unknown” calls were asked to independently write down tips for coding calls and using the software properly – limiting their advice to both sides of a standard sheet of paper. The team then had these staffers compare notes and come up with a single page of standard operating procedures that the rest of the call center staff was trained to use.

◉ A mentoring system was established in which top performers helped the poorest performers. Initially each top performer would sit with a poorer performer for a half-hour and offer suggestions. Then the poorer performer would observe the top performer for a half-hour to pick up additional insights.

A third effort was launched to reduce the types of calls that were received most often. To address the problem, the project team expanded to include associates from the branches. The enlarged team then brainstormed ideas to reduce the most common call types. As a result, some new documentation was added to products to clarify instructions, and information was added to certain computer screens within the system to reduce questions and confusion. The team saw immediate improvement from these actions (Figures 4 and 5).

Six Sigma Study Materials, Six Sigma Certification, Six Sigma Learning, Six Sigma Prep

Figure 4: AHT Improvement – Policy and Procedure Calls

Six Sigma Study Materials, Six Sigma Certification, Six Sigma Learning, Six Sigma Prep

Figure 5: AHT Improvement – System Support Calls

In addition to the average handling time improvements, were these:

◉ The number of “unknown” calls quickly dropped to 10 percent.
◉ Customer satisfaction ratings from quarterly client satisfaction surveys improved.

As the average handling time dropped and service improved, the call center was able to reduce the workforce. (This was done without layoffs, through attrition.) Within the first year, the actual cost savings was $732,000, well above the initial target of $500,000.

The Control Phase


The Control phase of the project emphasized:

◉ Continued enforcement of the standard operating procedures.
◉ Use of control charts by office team leaders, who have the responsibility and authority to act if the average handling time starts to drift upward.

The team also created plans for continual monitoring of which call types consumed the most handling time, along with continuing the collaborative efforts with branches to address those calls.

Key Lessons Learned


Lessons that the team documented as advice to other project teams included:

◉ Six Sigma provides a disciplined step-by-step method to:
     ◉ Define the gap in performance and identify possible causes.
     ◉ Solve for root cause and validate solutions.
     ◉ Sustain improvements and share learning.
◉ It is critical to validate the measurement system. Had the team not discovered that the new software wasn’t being used properly by the associates, it could have wasted a lot of time on unsuccessful actions.
◉ Celebrate early wins in the project – don’t wait until the end.
◉ Chart progress in the most visual way possible, so everyone sees it.
◉ Peer coaching is valuable. It quickly helps the poorer performer and it should be positioned as a reward/recognition honor for the high performer.