Friday 26 February 2021

DOE in Software Testing: The Potential and the Risks

Testing software is hard work. Many aspects of software systems are difficult or impossible to observe and measure directly. That makes finding defects, characterizing performance and estimating reliability the toughest parts of the development process.

While there are no silver bullets (and no “lead bullets” either, as per Dr. Barry Boehm, noted software engineering professor and author), there are some tools and approaches in the Six Sigma toolkit that are worth understanding in connection with software testing.

A number of articles have pointed out benefits connected with the application of design of experiments (DOE) – and fractional factorial designs in particular – to software testing. While statistical approaches like this do hold promise, those who use them need to understand them in a balanced way – looking for where they do and do not fit. Test designers also should understand some of risks involved.

Strengths of DOE in Test Planning


DOE provides, at the very least, a way to think about the whole range of test conditions that could be considered. DOE helps a test designer to think in terms of “factors” and “levels” that describe prospective test conditions (Table 1). That alone can help identify the test landscape and scope the magnitude of a particular test challenge.

Table 1: Factors and Levels
Test Situation Factors  Levels 
External States Printer Status Ready, Busy, Off
Data Entry  Data Field 1  Empty, Wrong Type, Wrong Value 
Internal States  Memory  Available, Unavailable, Corrupt 
I/O  File System  NTFS, FAT32, Custom 

Part of the “design” in a DOE is to assemble factor combinations into and efficient set of cases that make the best use of limited amounts of data. That fits with the test challenge to learn as much as possible, in limited time, without the luxury of exhaustive coverage of all possible data.

Full Factorial DOE Designs


A full factorial design looks at all possible combinations of the factors at all their levels. While the benefits of DOE are more pronounced with more factors and levels, a simple three-factor case is a good way to illustrate some key points. A full factorial design for three factors, like “workload,” “number of servers” (roundtrip in a transaction) and “security overhead” – each at two levels, would call for eight cases.

Six Sigma Tutorial and Material, Six Sigma Learning, Six Sigma Certification, Six Sigma Preparation, Six Sigma Exam Prep, Six Sigma Career
Figure 1: Full Factorial Design Three Factors and Two Levels

The eight test cases depicted in Figure 1 allow for the isolation of the impacts of each factor on the test results (response time), and for the quantification of interactions (beyond the scope of this article). In a full factorial, a test designer gets all the information, but must pay for it. Three factors at two levels are easy enough to study exhaustively, but more factors and levels require more resources. Six factors, for example, at just two test levels each, call for 64 cases in a full factorial. The information paid for in running such a large test set would include the isolation of the effects of complex interactions (3-,4-,5- and 6-way) that are very rarely important. Experimenters, like testers, strive to focus resources on the information most likely to be valuable, and they see the inefficiency in large factorial designs. Interest in spending less time and effort to uncover the specific behaviors of interest usually favors fractional factorial designs in test settings.

Fractional Factorial Designs


As the name indicates, a fractional factorial looks at a subset of all possible combinations. Not just any subset though. There is a smart way to skip and keep test cases so that the smaller plan has a good chance of learning most of what the larger plan would have. A look at the logic and then a walk through of the uses and risks would valuable.

Looking at Figure 1, a good question is: “If you only had time to run four tests (not eight), which four would you run?” A little thinking will probably result in what DOE suggests – a plan like the one shown in Figure 2.

Six Sigma Tutorial and Material, Six Sigma Learning, Six Sigma Certification, Six Sigma Preparation, Six Sigma Exam Prep, Six Sigma Career
Figure 2: Fractional Factorial Design

The four test cases depicted in Figure 2, do a pretty good job covering the domain of the complete set of tests. Thinking in the geometry of the illustration, each face of the three-factor cube is covered with two 2 test cases. The test result for each missing case can be estimated using the combined information from the included cases. The logic in such a design is – if the behavior of the system under test is fairly “continuous” – what gets learned in the four test cases that are run can be used to interpolate what would be expected at the cases that were not run.

What does it mean to be continuous? Factors like workload and number of servers probably each influence the overall response time in a smooth, additive way. More or less workload and/or more servers likely push the response time up or down in a reasonably behaved way. There are not big spikes up or down at unknown points. In contrast, if the factors were application and file type (graphics, text), there could well be a certain combination that is quite unlike any others. Trying to study the part in order to know more about the whole could be futile. Unfortunately this cannot be reduced to a simple rule set. However, knowing about the nature of the performance being tested can to guide the tester toward or away from fractional test designs. 

Fractional Factorial Case Example


An example helps illustrate the workings and potential limits of a fractional approach. A team decides to test for response time in system with the three factors (workload, number of servers and security overhead), and using just four test cases illustrated on the cube. Each test result for response time (unitless for simplicity) for each factor combination is shown at its corresponding location on the test case cube (Figure 3). Response time is considered a “fail” when above 300. 

Six Sigma Tutorial and Material, Six Sigma Learning, Six Sigma Certification, Six Sigma Preparation, Six Sigma Exam Prep, Six Sigma Career
Figure 3: Fractional Test Design Response Time Measured in Four Test Cases

As mentioned, the cases that are included in a fractional design can be used to predict the results for cases not done. None of the tested cases failed, but the results were used to interpolate the untested cases. Figure 4 illustrates those predicted values.

Six Sigma Tutorial and Material, Six Sigma Learning, Six Sigma Certification, Six Sigma Preparation, Six Sigma Exam Prep, Six Sigma Career
Figure 4: Fractional Test Design Predicted Response Times for Cases Not Run

In this case, the fractional data suggests that the case in the upper right corner of the cube could be a “fail” condition (response time greater than 300). Actual testing at the point bears that out. 

Table 2: Predicted Versus Actual Response Times at Points Initially Untested

Test Cases   Response Time 
Workload Servers Security Predicted  Actual 
Small  High  268.04 264.8
Small  Low 281.40  260.8 
Large  Low  266.36  277.7 
Large  High  312.20  302.8 

Looking at Fractional DOE Drawbacks and Risks


The case so far describes a situation where a fractional approach paid off. Testers are not always so lucky. As discussed, if one or more factors influences the test result in a discontinuous way or if there are large unaccounted interactions between the factors, a single point that is left out in a fractional design can be the one place that the system comes to its knees. Where that concern is active there is no substitute for actually observing the cases with highest risk. 

It should be noted that there are interim strategies that combine fractional designs supplemented with cases of special risk (and perhaps excluding cases known to be very low risk). Some DOE software offers “D-optimal” designs, which basically ask for information about: 

◉ How many cases are there time and resources to do
◉ The factor effects and interactions to study
◉ Any test cases that should be excluded (already tested or impractical)
◉ Any test cases that should be included (special risk or interest)

From there, D-optimal design software searches for the best set of test cases that fit the test needs and resource constraints. 

Looking at More Test Factor Combinations


A quick tour of a larger fractional test case may round out the picture a bit. The test setting for the three factors used here actually includes three others as well – Client CPU (2.8, 4.0) Server CPU (3.5, 4.5), and data compression (light, complex). Testing response time for all six factor combinations would call for 64 cases (26). 

A fractional design of only eight cases was used, replicating each test (to observe response time variation) to give a total of 16 test cases. This is still just 25 percent of the exhaustive plan. 

Figure 5, showing the distribution of results, indicates that about 25 percent of the cases were failures. 

Table 3 sorts the results, isolating the failures. It can be seen that no one factor is responsible for the failures. As expected, it is the combined effect of all the factors in concert that drive the overall result. Using that rule of thumb in this case, every factor except Client CPU could be deemed significant. There is a lot more involved in interpreting these outputs, but the focus here is only on the simple basics.

Six Sigma Tutorial and Material, Six Sigma Learning, Six Sigma Certification, Six Sigma Preparation, Six Sigma Exam Prep, Six Sigma Career
Figure 5: Distribution of Test Results

Table 3: The Sorted Details – Failures Top the List
Workload Client CPU  Server CPU  Compression  Security  Servers  Response Time 
Large 2.8 3.5 Light Low 6 318.4
Large  4.0  4.5   Complex  High  310.7 
Small 2.8  3.5  Complex  High  308.0 
Large  2.8  3.5  Light  Low  302.5 
Small 4.0  3.5  Light  High  301.9
Large 2.8  4.5  Light  High  299.6 
Small 2.8  3.5  Complex  High  298.3 
Large 4.0  4.5  Complex  High  290.1
Large  2.8  4.5  Light  High  281.2 
Large  4.0 3.5  Complex  Low  275.4 
Small  4.0  4.5  Light  Low  272.4 
Large  4.0  3.5  Complex  Low  268.8 
Small  4.0  3.5  Light  High  266.8 
Small  4.0  4.5  Light  Low  265.3 
Small  2.8  4.5  Complex  Low  232.9 
Small 2.8  4.5 Complex  Low  210.0 

Figure 6 shows how the analysis of variance (ANOVA) can be used to single out the impacts of each factor on the test result. The slope of each line provides a quick visual cue to each factor’s relative impact. Client CPU has the least impact (almost a flat line) and number of servers has one of the strongest impacts. 

ANOVA further quantifies factor effects, as shown in Table 4. The “sequential sum of squares” for each factor gets larger as the factor shows more influence, and the p-value for each factor gets smaller (in its 0-to-1 probability scale) as the factor influence is seen as statistically more significant. Experimenters often use a p-value threshold of about 0,10, view factors with values below that level as worthy of attention and inclusion in the model. 

With this plan, the failures detected and those predicted (for the untested cases) found about 95 percent of the fail conditions that were uncovered in a follow-up exhaustive test. There is no guarantee, of course, that any particular application will find similar results.

Six Sigma Tutorial and Material, Six Sigma Learning, Six Sigma Certification, Six Sigma Preparation, Six Sigma Exam Prep, Six Sigma Career
Figure 6: Factor Effects on Response Time

Table 4: Analysis of Variance for Response Time, Using Adjusted Sum of Squares for Tests
Source DF  Seq.SS  Adj.SS  Adj.MS 
Workload 1 2282.5 2282.5 2282.5 13.17 0.005
Client CPU  0.0  0.0  0.0  00.00  0.993 
Server CPU  1978.0 1978.0  1978.0  11.41  0.008 
Compression  810.8  810.8  810.8  04.68  0.059 
Security  2779.9  2779.9  2779.9  16.04  0.003 
Servers  3280.4  3280.4  3280.4 18.93  0.002 
Error  9 1559.8  1559.8  173.3     
Total  15  12691.4        
S = 13.1646 R-Sq = 87.71% R-Sq (adj) = 79.52%      

Thursday 25 February 2021

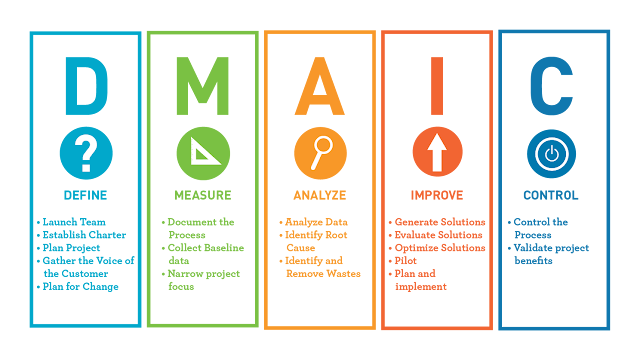
What Is DMAIC?

DMAIC, Six Sigma Exam Prep, Six Sigma Learning, Six Sigma Certification

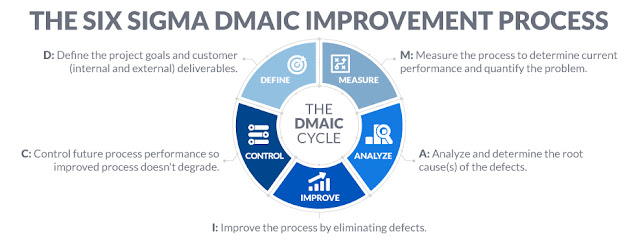
DMAIC is an acronym for Define, Measure, Analyze, Improve, Control. DMAIC is the process improvement methodology of Six Sigma that’s used for improving existing processes.

DMAIC is pronounced: Duh-May-Ick.

What Is DMAIC?


DMAIC refers to a data-driven quality strategy for improving processes, and is an integral part of the company’s Six Sigma Quality Initiative. DMAIC is an acronym for five interconnected phases: Define, Measure, Analyze, Improve, and Control.

DMAIC, Six Sigma Exam Prep, Six Sigma Learning, Six Sigma Certification

DMAIC Process Steps


Each step in the cyclical DMAIC Process is required to ensure the best possible results. The process steps:

Define the Customer, their Critical to Quality (CTQ) issues, and the Core Business Process involved.

Define who customers are, what their requirements are for products and services, and what their expectations are
Define project boundaries ­ the stop and start of the process
Define the process to be improved by mapping the process flow

Measure the performance of the Core Business Process involved.

Develop a data collection plan for the process
Collect data from many sources to determine types of defects and metrics
Compare to customer survey results to determine shortfall

Analyze the data collected and process map to determine root causes of defects and opportunities for improvement.

Identify gaps between current performance and goal performance
Prioritize opportunities to improve
Identify sources of variation

Improve the target process by designing creative solutions to fix and prevent problems.

Create innovate solutions using technology and discipline
Develop and deploy implementation plan

Control the improvements to keep the process on the new course.

Prevent reverting back to the “old way”
Require the development, documentation and implementation of an ongoing monitoring plan
Institutionalize the improvements through the modification of systems and structures (staffing, training, incentives)

Wednesday 24 February 2021

Continual learning and your cognitive health

Prince2 Tutorial and Material, Prince2 Certification, Prince2 Learning, Prince2 Exam Prep, Prince2 Preparation

Continual learning has been shown to be fantastic for our cognitive health, particularly when you learn something new and practice it. In this article we delve into mind health and the advantages of structured learning throughout your life and career.

The benefits of continual learning

Just as exercise has been proven to be good for your physical health, continual learning is unquestionably valuable for your mind health. Education has even been linked to a longer life expectancy!

Structured learning has been shown to reduce rates of anxiety and depression, and lower stress levels. This in turn can mean better cardiovascular health, an improved immune system, lower blood pressure and less risk of common chronic disease. Evidence that continuing to learn does great things for our quality of health and for our brains.

Ongoing learning also limits our cognitive and memory decline as we age. Harvard Medical School has found that new brain cell growth can readily happen in adulthood through the processes of training, acquiring information and new experiences. Continued learning can stimulate the process of new cell growth and keep our brains functioning at optimum levels.

The saying goes ‘use it or lose it’, and when it comes to our brain health it is important to practice what you have learned. When you challenge yourself to learn something new, you are forming new cells and new neural connections. Over time we lose brain cells, so it is paramount that we train our brains continually so as not to become stagnant.

Cognitive health and your career

Intellectual growth and expansion can be of vast value for your career. As you learn, you better your cognitive flexibility – meaning you can switch between tasks with ease. You also strengthen your decision-making abilities and improve problem-solving functioning, which can only be a good thing in the workplace as you are more able to make the right call in challenging scenarios.

A healthy, stimulated brain will also have better memory functioning which can prevent you from chasing up tasks and employees unnecessarily. What’s more, boosted memory and information retention will allow you to recall past events in order to learn from them.

On the path of continual learning, you are bound to feel a great sense of accomplishment. Pair this with improved outcomes from upgraded skills and you have a recipe for improved self-confidence at work too. All of these positive effects can do wonders for your career, your prospects, and can set you up for a bright future.

Committing to a journey of continued learning

Prince2 Tutorial and Material, Prince2 Certification, Prince2 Learning, Prince2 Exam Prep, Prince2 Preparation
Despite its vast and varied benefits for the health of your brain, body, and career, committing to a journey of continued learning can sound like a huge undertaking, but it needn’t be. There is no set rule for hours of learning per week, nor a one-size-fits-all approach. What matters is that you choose a path of continual progression and that you make time for growth. To successfully establish good learning habits, you must do what works for you. It could be as simple as setting aside time every day for reading!

Committing to gaining a professional qualification is a surefire way to strengthen your cognitive health. At PRINCE2.com, we offer a range of professional development training courses which are designed to fit around you and your learning style. Our e-learning courses for example, offer a twelve month window for completion, allowing you to slot learning into your schedule as and when, meaning you keep your mental activity thriving.

There is a lifelong value to learning, for our health, our careers and our wellbeing. And so, shooting to supercharge your cognitive functioning has a host of benefits. A brain which is strengthened by continual learning is more engaged with improved functionality. (And let’s not forget that extended lifespan!)

Source: prince2.com

Monday 22 February 2021

The Importance of Vision Casting

Six Sigma Tutorial and Material, Six Sigma Certification, Six Sigma Learning, Six Sigma Preparation, Six Sigma Guides

Lean Six Sigma (LSS) practitioners can get so focused on the analytics of our DMAIC (Define, Measure, Analyze, Improve, Control) and Kaizen efforts that we can neglect the softer aspects of creating substantial lasting change. The following is a practical summary on how to cast a vision and help inspire your teams and stakeholders to dream bigger and improve more.

Fighting Fires

A man was promoted to leader of an application operations team. This team monitored applications 24/7 and responded to application outages and customer impacts regularly. The new leader noticed his team was engaged in firefighting mode much of the time. He wanted to inspire them to think differently about their role.

So, what did he do? He called the fire department! He literally called the fire department to see if there were any metaphorical insights he could gain from them to translate to his team’s situation. He was pleased to find there was a person working there whose job included addressing such odd inquiries.

The fire department had experienced a dramatic decrease in deaths due to fire over the last 15 years. The city had also experienced vast reductions in property damage due to fire. The new manager wondered what was the secret that brought about such bold improvements. Did the fire department find more efficient ways to put out fires? Did they develop new chemical methods that would put the fires out faster?

The answer was unexpected. The massive improvements came as the fire department seemed to shift its primary focus away from fighting fires. Instead, they focused on two areas:

1. Fire prevention

2. Training

The department began a vast campaign to inform citizens how to prevent fires. They held fun, entertaining training assemblies in schools to teach children about fire prevention. They ran advertisements on local TV stations about ways to prevent fire. Firefighters would travel to the homes of families who could not afford smoke detectors and install one for free. The fire department sought policy changes to city codes to guarantee smoke detection systems in new buildings.

The result of the shift from firefighting to fire prevention was a long-lasting dramatic improvement in the safety and well-being of the city. The fire department had additional time to respond to medical emergencies before ambulances arrived, leading to more lives saved.

Armed with these great insights, the new manager translated the concept to his new team. He cast a vision for them on how they could switch from fighting fires to preventing fires in the applications space. The team embraced the new perspective. They began to create tools that worked as “smoke detectors” for applications, providing early warnings when an application might fail so they could address it before it was a “fire.” They focused on training, so they could understand how to address application issues with greater acumen.

The result: The team saw dramatic and lasting improvements. There were fewer outages, fewer customer impacts and greater customer satisfaction. Furthermore, the team’s satisfaction increased. They knew they were part of accomplishing something of value and their day-to-day work life was more peaceful.

Why Is Vision Important?

Our reality is limited by what we first mentally create. In other words, if we don’t first dream it, it will not come to be. We must envision a potential improvement ourselves, then we need to share the idea with teammates and stakeholders so they can begin to understand and visualize the value of the change we desire. As they see it in their mind’s eye, they can begin to act on it until it becomes a reality.

Nothing of value will get accomplished unless people can visualize the value in their mind first. Then they will be engaged to act.

5 Practical Steps to Casting a Vision

You have experienced the cold reality that people seem to fear change when having to change themselves and when trying to encourage others to change. We need to embrace the axiom that people do not fear change, they fear the unknown. As we cast a vision for a new and better future, people can free themselves from the fear of change as their unknown becomes known in their hearts and minds. Here are five practical steps to help you cast a compelling vision.

1. Have a Vision

It may sound simple, but before you can compel others to join in on a change, you must have a dream or idea of what you want to change. As LSS practitioners, when we embark on a DMAIC project, our project charter should paint a picture of what we hope to accomplish. At this stage, we do not yet know what the root causes are or the specific improvement steps we must take. But we can hold fast to a vision of the overall goal we hope to accomplish. And we can embrace with passion the potential the improvement will bring to bear.

At times we can view the project charter as a somewhat cold listing of facts devoid of enthusiasm. Don’t lose sight of the opportunity to use this tool to speak with passion about the advantages of the new reality you propose in the change you will introduce.

2. Share the Vision

Next, we need to engage others in the vision. There are standard methods to communicate this vision such as sharing of the project charter and engaging in stakeholder meetings.

Less traditional methods may assist as well. Consider holding a vision-casting session where you invite participants to engage in a more contemplative way about areas you want to improve. Have them visualize in their mind the problem you are hoping to solve. Then have them visualize what life would be like if the problem did not exist or were greatly improved. Have them share as a group how their particular area would be better off. For example, you could ask a series of questions like the following:

◉ Think about what you feel is the greatest issue we face as an organization now. Give the participants time to think about this and perhaps journal some ideas on the question.

◉ How would your life (or the lives of those we serve) be different if this issue no longer existed? Again, give the participants time to think about and journal their thoughts.

Then share some ways to address the issue, or perhaps have your first brainstorming session on possible improvement opportunities to bring about the overall vision.

You may also want to consider the marketing rule of seven. This rule states that for people to “hear” your message they need to encounter is seven times. Consider different ways to spread the word so people can encounter and contemplate the value of your vision seven times in seven different ways (i.e., emails, social media, meetings, brainstorming sessions, etc.).

3. Fan the Flames of the Vision

Encourage people to join in the dream of the new reality you are proposing. Here are a few ways to accomplish this.

◉ Advertise your wins. As you start the process of implementing some improvements, spread the word on any wins along the way. People will see the success and be more willing to join in on the remainder of the efforts.

◉ Advertise wins from other groups who have done something similar.

◉ Share practical examples of the value your change will add if implemented. For example, if you see a problem that exists on a given day, remind your stakeholders that your goal of the change you will implement is to eliminate the pain in question.

4. Execute on the Vision

If you plant a vision in someone’s heart and mind you must execute on it. This is the most important of the five steps listed. If you cause people to dream of a new hope and the hope does not come to pass or is deferred, those who initially embraced the vision will become jaded to your future proposals.

There are many methods to assist in executing on a plan. As you go through the phases of a DMAIC effort you will measure and analyze to determine the root causes of your current state and then prioritize which root causes to address. During the Improve phase, you will begin to implement your real-world improvements. And then during the Control phase you will set up ways to make sure the improvements remain.

As you execute, following best practices in a DMAIC project, people will see your vision turn to reality and will be more likely to embrace future improvement ideas.

5. Advertise and Reward the Accomplishment of the Vision

Once the improvement happens spread the word. Let people see what has happened. The vision you cast has come to pass in reality. This will not only encourage people to accept your future vision-casting opportunities but will encourage and empower some to begin doing the same.

Six Sigma Tutorial and Material, Six Sigma Certification, Six Sigma Learning, Six Sigma Preparation, Six Sigma Guides

Reward those who helped in bringing about the improvements in whatever ways you can, such as through words of praise, monetarily or comp time off. In the example at the beginning of this article, the manager was able to give large bonuses to those who took the time to invent smoke detectors for their applications. As you implement improvements this will often result in money and/or time savings. You can give a portion of the savings to the staff that helped implement it.

Final Thoughts

It is easy to underestimate our ability to bring about great change. We may think, “Who am I to call people to change?” Remember, however, most great changes throughout history were made by people who started out as average humans. Perhaps the most important vision to cast is the belief in yourself – you can be an agent of lasting positive change in your world. What vision will you cast to improve your sphere of influence? What dream will you impart and then execute on to make your world a better place for others?

Saturday 20 February 2021

Implementing a Customer Satisfaction Metric

Organizations evaluate themselves by measuring customer satisfaction with their products or services. As organizations evolve, the measurement of customer satisfaction across the entire organization becomes imperative. The first step is for an organization to implement a metric for tracking customer satisfaction.

To develop a metric, an organization should explore these questions:

◉ Who are its customers?

◉ What type of survey should be administered to them?

◉ How will satisfaction be measured across the organization?

The answers to these issues, along with an understanding of the Servqual survey framework and a voice-of-the-customer (VOC) matrix, will aid in the implementation of a customer-satisfaction metric.

Understanding the Customer

A rule for implementing a satisfaction metric is that customer satisfaction must be measured for every function and every service of an organization. There are usually many interlinks among the services and products within an organization. For instance, a typical information technology (IT) company provides a variety of different products in the market and, in addition, a number of services for those products, such as help-desk or desk-side support, IT infrastructure, and network security.

In such a complex IT organization, the services get classified into functions, such as sales and operations. Thus, the first step is to identify the customers, both internal and external, for each of the functions throughout the organization.

For example, for the application development team, customers would include the application users, along with some internal people to whom services are catered.

Dimensions of Customer Satisfaction


The next step is to determine the strategy for collecting the VOC. The challenge is to develop survey questionnaires to measure customer satisfaction with the various aspects of a product or service, such as the actual product, the processes followed (for instance, for a warranty), and the quality of service.

There are different theories for understanding customer needs and arriving at specific factors for measuring customer satisfaction. One widely used framework for measuring customer satisfaction is Servqual, developed in the 1980s by Valarie A. Zeithaml, A. Parasuraman and Leonard L. Berry. The method is also known as the RATER model, because it prescribes measuring satisfaction in these five dimensions:

◉ Reliability – A company’s ability to perform the promised service dependably and accurately

◉ Assurance – The knowledge, competence and courtesy of employees and their ability to convey trust and confidence

◉ Tangibles – Physical facilities, equipment and appearances that impress the customer

◉ Empathy – The level of caring, individualized attention, access, communication and understanding that the customer perceives

◉ Responsiveness – The willingness displayed to help clients and provide prompt service

The Servqual dimensions can be used as the high-level survey categories in a questionnaire. Other guidelines to follow when developing a questionnaire:

◉ Use a Likert-scale rating (a respondent’s level of agreement with a statement) for customer responses for all questions.

◉ Assign an importance weight to each dimension of the survey. The importance weight, combined with the customer rating, helps an organization identify areas for improvement. Because the questions and the assigned weights might differ for each survey, it may not be possible to aggregate the total score at the dimension level. In such a case, assign function-level and organization-level weights to the dimensions in order to prioritize the dimensions to be focused on (Table 1).

Table 1: Sample Importance Weights at Function and Organization Levels

Dimensions (Based on SERVQUAL Framework) Organization-Level Weights   Function-Level Weights  
Reliability 3 5
Responsiveness  4
Assurance 
Empathy 
Tangibles  2 5 1 3 5

◉ Include an overall satisfaction question. This can be aggregated at every level – functional as well as organizational – in every survey.

The customer satisfaction level should be measured for every function of a business using surveys designed with these guidelines. Each team within the function should develop its survey questionnaire in the same fashion to ensure consistency. This way measurement is consistent across the organization.

Developing the VOC Matrix


One of the tools used for customer-satisfaction assessment across an organization is the VOC matrix shown in Figure 1. This analysis tool helps in evaluating the relative customer value of the service provided, determining the key performance drivers for meeting customer requirements and deciding the potential focus areas for improvements.

Six Sigma Tutorial and Material, Six Sigma Certification, Six Sigma Preparation, Six Sigma Guides, Six Sigma Career
Figure 1: Voice of the Customer Matrix

The prioritization matrix examines the relationship of various service areas or process steps with prioritized customer requirements. The purpose of this tool is to determine which processes have the strongest correlation to the requirements. It uses inputs from the customers on not only their requirements but also the relative priority ranking for each area. The steps for developing a VOC prioritization matrix are:

1. List the company’s service areas across the column headings
2. List the dimensions and the survey questions in the rows
3. Put the customer’s ranking of relative importance for each survey question after each question
4. Put the total score as the last column in the grid
5. Determine the total score for each question by multiplying the rating for each function by its importance weight and adding the products together
6. Repeat building this matrix at all levels or business functions

Six Sigma Tutorial and Material, Six Sigma Certification, Six Sigma Preparation, Six Sigma Guides, Six Sigma Career
Figure 2: Sample VOC Matrix for the Business Function Customer Support

Analyzing the VOC Matrix


Using the Servqual survey mechanism and the resulting matrix, it is possible to calculate metrics to be implemented organization-wide. The metrics are:

◉ Satisfaction rating – This can be aggregated by question or dimension. Table 2 shows a satisfaction rating gathered within a single question; Table 3 shows a satisfaction rating aggregated from responses to all questions within a single dimension.

Table 2: Sample Satisfaction Rating at the Survey Question Level

Please Rate How Well the Product Met Your Requirements 
Response options (1 = Poor, 5 = Excellent)
Number of responses   5   8 23  22 
Percent of responses   8.6    13.8   39.7  37.9

Table 3: Sample Satisfaction Rating at the Dimension Level

Reliability
Response options (1 = Poor, 5 = Excellent)
Number of responses   12 7 11 25  45 
Percent of responses   20.7 12.1  19  43.1 77.6

◉ Satisfaction score – This is the efficiency score (rating x weight) for each question. It is used to determine the focus area for potential improvement. The highest-ranked service areas indicate the strongest performance in meeting customer requirements; the lowest indicate areas that do not meet customer requirements.

◉ Composite satisfaction index – The composite score is derived by calculating an efficiency score (rating x weight) for each function, based on the mean of ratings from the questionnaire and the weights given to each dimension at the function or organization level (Figure 3).

Six Sigma Tutorial and Material, Six Sigma Certification, Six Sigma Preparation, Six Sigma Guides, Six Sigma Career
Figure 3: Sample Composite Satisfaction Index

Dimensions with high scores are satisfactory or need to be further strengthened; low-scored areas with high weight are dissatisfactory and should be further analyzed for root causes and to develop an action plan for improvement.

Tools that support this root cause analysis are correlation analysis, logistic regression, ANOVA or chi-square, or design of experiments. The VOC results are also necessary inputs for developing a control plan or FMEA (failure mode and effects analysis).

Successful Implementation


Implementing the customer satisfaction metric across an organization requires a well planned execution. In order to produce meaningful results, importance must be placed on areas related to completeness and accuracy of data during the survey process. Techniques such as Servqual are ideal for building effective survey systems; however, these need to be supplemented with tools such as the VOC matrix to capture the quality and importance of a service from the customer’s perspective.

The lifecycle for these initiatives starts and ends at the customer. Even though a variety of tools and techniques are available, success truly depends on consistency and accuracy in measurement across an organization.

Friday 19 February 2021

Reducing Cycle Time for Six Sigma Projects

Six Sigma Tutorial and Material, Six Sigma Certification, Six Sigma Learning, Six Sigma Preparation

While Six Sigma continues to evolve, the most often cited complaint is long project cycle times. The obvious expense of eight to nine month (or longer) Black and Green Belt projects is opportunity lost. For example, a project that produces cost savings at a run rate of $30,000 per month leaves $150,000 on the table when it takes nine months versus four months to complete.

The less recognized but even more insidious cost of lengthy projects is erosion in management commitment. Managers with Black Belt overhead begin to question the affordability of Six Sigma.

Are long project cycle times inevitable with Six Sigma? No, Six Sigma project cycle times can be systematically reduced, thus improving the productivity of Black/Green Belts and satisfaction with Six Sigma.

Beating the Project Extenders


Talk to Six Sigma practitioners and you’ll find a long list of avoidable time consumers. A recent survey of 242 Deployment Leaders, Master Black Belts and Black Belts produced the following list of “project extenders”:

◉ Lack of reliable data on the process selected for improvement
◉ Re-scheduling of team meetings and “toll gate” reviews
◉ Changes in project scope
◉ Shifting of management priorities
◉ Resistance to change

A major cause of Six Sigma “project extenders” is the inability of most Belts to get the people running the business – line managers and employees – to put forth the effort to also improve the business. In simple terms, more Belts must know when, where and how to involve non-Belts in their projects. Mastering the skill of engaging non-Belts starts with recognizing a simple fact of business improvement: People’s motivation to change is highly perishable! For any Six Sigma practitioner, this means that time is not on your side. The longer it takes to get results and the more burdensome the involvement, the sooner everyone runs for the exits when Six Sigma Belts come around.

Three critical points in Six Sigma Deployments are key to driving faster project cycle times and bigger bottom-line results. At each point, Belts who can engage line managers and employees in the process make the difference between deployments that fail and those that transform the culture of the organization.

Better Planning Before Work Begins


Most Six Sigma initiatives do a good job of identifying project priorities – whether from a simple review of strategic plans and business goals or more sophisticated analysis. Where Six Sigma projects can lose steam is in the more tactical planning that occurs in the Define step of DMAIC.

The core of the problem is the lack of a structured approach for effectively engaging leadership teams before project work begins. The solution is no more complicated than developing a collective understanding of the performance drivers (X factors) that must be changed in order to achieve the desired end result (the big Y goal). With this known, leadership teams can assess the problem; weigh the benefits/risks/costs of attacking critical X factors; and, most importantly, match the right tools to opportunities for improvement.

Y = f (X)

The end result of this advanced planning is better understanding of project goals and more ownership by leaders who must sanction change. It also produces faster action on obvious opportunities where study and analysis are not required, or simply wasteful.

This type of project planning is not required for all Six Sigma projects, nor is it a skill every Belt requires. The biggest return comes from training Black Belts to apply this discipline on projects that need solutions to many X factors, have high human factor quotients and will require multiple improvement methods (statistical study, Lean design, Work-out, etc.).

Faster Quick Wins and Solution Deployment


Perhaps the biggest limiter to faster Six Sigma results is the lack of a reliable method for engaging frontline people in what they do best – taking action! The key is involving frontline managers and employees where they have the biggest impact and on issues they care most about. At two points the need for frontline involvement directly intersects with frontline motivation to change.

The first leverage point is in harvesting quick win opportunities. Quick win opportunities are “improvements in waiting” that do not require system and process design change. Such opportunities exist in nearly every Six Sigma project. Unfortunately, they often go unaddressed as Belts work their way through the DMAIC process.

The second leverage point is in solution deployment – the I and C phase of DMAIC projects. This is the time at which the burden shifts from the Belts to people doing the work. Defining CTQs, establishing reliable performance metrics and separating causes and effects is the domain of the Belts. Identifying solutions, implementing them and holding gains belong at the local employee level.

How can Six Sigma Deployments expand involvement of non-Belt team members without diluting the power of fact-based problem solving? One approach is so-called “Yellow or White Belt” training. However, this can be costly and produces mixed results. A more effective strategy is to equip Black and Green Belts with skills and tools for engaging frontline personnel in project execution. These tools can include group brainstorming; solution organization and prioritization; implementation checklists; and, results documentation templates.

Also the value of short, interactive meetings for frontline staff over long sessions filled with complex analyses should not be overlooked. And Belts should never miss an opportunity to create ownership which comes when people are encouraged to share ideas and be part of the solution.

In sum, to quickly reduce project cycle times, leave the detailed analysis to the Belts and engage the frontline in the heavy lifting of implementation.

Wednesday 17 February 2021

Solving the Dilemma Created by the No-Show Patient

Six Sigma Tutorial and Material, Six Sigma Certification, Six Sigma Preparation, Six Sigma Career, Six Sigma Guides

When scheduled patients fail to show up for their exam, they cause an interruption in the scheduling process, which creates inefficiency in the delivery system. If schedulers are able to fill the open time slot with another patient, the problem is limited to the inefficiencies created by extra work. If the open time slot cannot be filled, the no-show costs the facility a revenue opportunity. Healthcare facilities must put measures in place to control no-shows in order to allow the delivery system to realize process efficiencies and minimize missed revenue opportunities.

In an attempt to control no-show activity, facilities often implement measures such as patient pre-exam notification or overbooking patients. Pre-exam notification, often in the form of a phone call, mailer or email, reminds the patient they have an exam scheduled. At the same time it increases the chance that the facility will get advance notice that a patient may miss a scheduled exam. Overbooking is an attempt to address the statistical certainty that some patients will not show up for their exam by booking more patients into the schedule than the facility has time slots.

While measures such as the ones mentioned above can somewhat control patient no-show consequences, they do not add efficiencies to the overall patient flow. In fact, these measures can create non-value-added quality check steps to the process or create bottleneck issues with patient flow, when actually the root causes for no-show activity have not been clearly identified.

Utilizing Simple Six Sigma Tools

Simple Six Sigma tools and methodologies can be utilized to help healthcare facilities understand the root causes of the no-show problem and identify the most effective measures to control or eliminate the issues causing patient no-shows. By putting measurement systems in place to collect data on the potential causes of patient no-show activity, the facility can begin to identify the critical factors affecting the no-show rate. Basic quality tools such as a Pareto chart, cause-and-effect diagram and check sheets can be used to sort through the “potential causes” list to evaluate the frequency of specific reasons patients fail to show up for their exams. This in turn will help the facility focus on the vital few causes (critical factors). By setting both a target and a specification limit for acceptable no-show rates, the facility can then begin to look at the process and identify where the critical factors are occurring.

Understanding Root Causes Is the Key

Understanding the root causes is the key to identifying solutions that control patient no-show rates to acceptable levels. Through the analysis and application of Six Sigma tools, issues may come to the surface that might otherwise not have been considered as having an effect on the no-show rate, and some intuitive responses may be proven invalid. While each institution must let its own data lead it to the one solution or combination of solutions that will work best for it, here are some examples of areas that may impact the no-show rate and require appropriate actions:

◉ Patient transportation capabilities (public transportation, parking fees)

◉ Patient child care needs

◉ Demographics of patients not arriving for exams

◉ Patient co-pay concerns

◉ Scheduling errors (double scheduled, cancellation)

◉ Excessive backlog

◉ Time of day

 Action Plans Based on Root Causes

Any trends noted in these or any other areas that present during data collection would be candidates for further investigation by the facility working to solve this problem. Specific action plans can be developed for correcting the root causes creating most of the defects in the process. Action plans based on the root cause trends could include:

◉ Schedule according to public transportation availability, waive parking fees, provide taxi vouchers, etc.

◉ Address unique payment arrangements for co-pays

◉ Provide timely/convenient scheduling, next-day service. Adjust schedule to cover peak hours of no-show activity

◉ Work with referring MDs with a high rate of no-show clients to insure the office is not double-booking, office is informing patient of exam date/time, etc.

Six Sigma Tutorial and Material, Six Sigma Certification, Six Sigma Preparation, Six Sigma Career, Six Sigma Guides

Once the action plans have been implemented, re-measuring the no-show rate will prove the effectiveness of the strategy. Additional action steps can be taken as needed. Ongoing monitoring will help the facility measure how well the process remains in control and if the improved results are sustainable.

Reaping the Benefits

Institutions that use a data-driven methodology to identify and control root causes of no-show activity are better able to discover untapped efficiency and predictability in their exam delivery systems. As efficiencies are realized through control of the root causes, additional activity such as the previously mentioned pre-exam notification will serve to enhance the predictability of the delivery system. Specific scripting of this pre-exam communication can provide the facility with necessary details to expedite the exam process, thus adding additional efficiencies to the process. Understanding, controlling and eliminating root causes of no-show activity allow healthcare facilities to gain higher returns from additional activities aimed at improving the efficiency and predictability of exam delivery systems.

Monday 15 February 2021

Leveraging Kano and QFD for Requirements Management

The quality of a product or service is a key element in creating customer satisfaction. The level of satisfaction is ultimately dependent on the fulfilment of customer needs. The Kano survey is a valuable tool for capturing the voice of the customer (VOC), providing critical information on the importance of products and services and the level of satisfaction from the customer’s perspective. Quality function deployment (QFD) is an important tool in translating VOC into product specifications. It is the only comprehensive quality tool aimed specifically at translating and comparing customer satisfaction measures.

Read More: Lean Six Sigma Academy Certified Lean Six Sigma Green Belt (LSSA-GB)

Used in combination, the Kano survey and QFD tools provide companies with the ability to maximize customer satisfaction (positive quality) measured by metrics such as repeat business and market share. There are significant benefits in using the Kano method to capture client perception and the QFD model to understand the relationship between product features and customer satisfaction.

An example illustrates how the use of Kano and QFD improved a corporate quality function help desk.

The corporate quality function help desk is an intranet-based help desk tool used extensively by process improvement practitioners. The effectiveness of the help desk is measured against service-level agreements established by the help desk administrators. A turnaround time (TAT) metric was adopted for gauging internal customer satisfaction with the help desk. However, in spite of highly favorable TAT results, various qualitative comments captured in customer surveys indicated dissatisfaction. As a result, administrators of the help desk (referred to as the QDI help desk) needed to find an effective way to collect the exact requirements of customers and to identify an appropriate solution.

Kano Model and Kano Survey

The Kano model classifies product attributes based on how they are perceived by customers as well as the effect of the attributes on customer satisfaction. Since the impact on customer satisfaction is different for each customer requirement, it is important to determine which attributes of a product or service bring more satisfaction than others. The Kano classifications used to capture this information identify which attributes drive customer satisfaction, and indicate where a company should focus to retain market competitiveness. Meeting the customers’ basic quality needs provides the foundation for the elimination of dissatisfaction and complaints. Exceeding expectation creates a competitive advantage and leads to innovation.

In the example, a Kano questionnaire was designed to understand customer requirements and identify opportunities to improve the service provided by the help desk. First, key services offered through the help desk were analyzed to create a list of inputs for the questionnaire. These included:

◉ Response time

◉ Quality of reply

◉ Ease of use of the tool

◉ Relevance of the help desk in projects

◉ Clarity of communication

◉ Usefulness of the help desk-FAQ function

◉ Help desk discussion forum usage

◉ Usefulness of user manual

◉ Help desk facility value to software projects

The questionnaire design captured VOC relative to the importance of individual help desk services, current satisfaction level and ratings compared to other help desks used by the customer.

Collecting the Voice of the Customer

To capture VOC for the help desk, customers were asked to provide qualitative inputs on improving help desk performance and also rate each of the help desk features or attributes using the scale below.

◉ – Not used

◉ 1 – Not useful

◉ 2 – Useful to some extent

◉ 3 – Satisfactory

◉ 4 – Good

◉ 5 – Excellent

The survey sample targeted customers who utilized the help desk within the last three months and included a sample size of 10 percent to 20 percent of the total user community.

The Kano survey model measured customer perception of importance and satisfaction for specific help desk attributes. The attributes are classified in the following categories and plotted on the Kano importance/satisfaction grid (Figure 1):

1. Threshold/Basic attributes: Characteristics that must exist in order for the product to achieve success. The customer can remain neutral in attitude toward the product even with improved execution of the attributes.

2. One-dimensional attributes (performance/linear): Characteristics that directly correlate to customer satisfaction. Increased functionality or quality of execution will result in increased customer satisfaction. Conversely, decreased functionality will result in greater dissatisfaction.

3. Attractive attributes (exciters/delighters): Characteristics that give customers greater satisfaction and for which they are willing to pay a price premium. Satisfaction will not decrease below neutral if the product lacks the feature.

Six Sigma Exam Prep, Six Sigma Preparation, Six Sigma Certification, Six Sigma Tutorial and Material, Six Sigma Career
Figure 1: Kano Importance/Satisfaction Grid

Information collected through the Kano survey is analyzed to uncover specific response types. Indifferent responses represent attributes the customer generally ignores. If the attributes are present, the customer is generally satisfied. If they are not present, there is no impact on customer satisfaction. Questionable responses and reversals are client perceptions that contradict each other.

Stratification of Responses


To understand the VOC received through the Kano survey, an analysis of the information is required. Responses are interpreted using the following process:

Step 1: Obtain the importance of each feature by stratifying the responses into three categories:

◉ Percentage of responses with rating above 3
◉ Percentage of responses with rating equal to 3
◉ Percentage of responses with rating less than 3

Step 2: Match the importance data against each feature and determine a ranking from a scale of 1 to 10, where 10 is the highest rank. For example, importance data obtained for the help desk response time attribute reflected that 89.5 percent of users rated the feature above 4 on the scale of 1 to 5. Since this attribute received the highest percentage importance rating as compared to the other attributes, it was given a ranking of 10.

Step 3: Review the ranking for all features to identify metrics that are important for measuring customer critical-to-quality elements (CTQs).

Step 4: Define the degree of correlation between the VOC and the CTQ data to identify relational measures.

Correlation Between VOC and CTQ Data

Correlation Rating 
High 9
Medium 
Low 

Step 5: Review the relationship between individual metrics and eliminate any duplicate or irrelevant metrics.

Step 6: Perform a benchmark analysis using the competitive evaluation rating from the Kano questionnaire. The VOC data in the help desk example was used to compare customer perception of the corporate quality help desk to other help desk facilities used by customers participating in the survey.

Use of QFD for Help Desk Improvement


Once the VOC data was in-hand, the QFD tool, which many industries use to translate customer requirements to meaningful critical-to-quality attributes, was used to convert the VOC responses into technical requirements for the help desk.

The first level QFD/ first house of quality: The first step in developing the QFD is to consolidate and analyze customer responses and requirements. The requirements are segregated into categories based on the Kano survey model. The Kano survey results are used to create the first house of quality within the QFD tool (Figure 2).

Six Sigma Exam Prep, Six Sigma Preparation, Six Sigma Certification, Six Sigma Tutorial and Material, Six Sigma Career
Figure 2: First Level QFD

Based on the first level QFD, the top five metrics are:

1. Reply quality rating
2. Query turnaround time
3. Percentage repetitive queries
4. Discussion forum turnaround time
5. Hits on FAQs versus the number of queries received

The existing help desk processes were studied to determine the changes necessary to implement these metrics and a second house of quality was created (Figure 3).

Six Sigma Exam Prep, Six Sigma Preparation, Six Sigma Certification, Six Sigma Tutorial and Material, Six Sigma Career
Figure 3: Second Level QFD

 The second level QFD: Enabling the help desk to select the following features for implementation:

1. Feedback for the quality of reply.
2. Monthly data processing with analysis for repetitive queries.
3. Auto reminder mail to be sent from help desk for queries posted.
4. Monthly analysis of the metrics: Hits on FAQs versus number of queries.

The QFD results provided an understanding of customer priorities, customer perceptions and the metrics necessary to ensure that customer requirements are addressed. The composite metrics resulting from the QFD are reflected in Figure 4.

Six Sigma Exam Prep, Six Sigma Preparation, Six Sigma Certification, Six Sigma Tutorial and Material, Six Sigma Career
Figure 4: Composite Metrics Derived from QFD

As a result of the QFD process, the help desk implemented a number of enhancements to address customer-specified requirements. The help desk administrators monitor the composite metrics with the help of individual and moving range (I-MR) control charts allowing them to identify assignable causes quickly and effectively (Figure 5).

Six Sigma Exam Prep, Six Sigma Preparation, Six Sigma Certification, Six Sigma Tutorial and Material, Six Sigma Career
Figure 5: I-MR Control Charts

Friday 12 February 2021

Manage IT Projects and Resources the Six Sigma Way

Six Sigma Tutorial and Material, Six Sigma Learning, Six Sigma Guides, Six Sigma Career, Six Sigma Preparation

Best-practice companies have been using Lean Six Sigma to drive Information Technology (IT) improvements and better software designs for years. But broad acceptance, despite proven results in the sector, has been slow. This may be due to a lack of understanding about the processes and benefits of Lean Six Sigma. By exploring how Lean Six Sigma is used at these best-practice companies and learning the answers to some common questions, software and IT organizations not already using Lean Six Sigma can gain a greater understanding of what they are missing.

Software and IT: The Last Improvement Frontier

Underperforming and benchmark IT processes alike face many of the same issues. These problems have been well known to practitioners of Lean Six Sigma for years, and include the following traits of poor IT portfolio management practices:

◉ Poorly defined processes

◉ More projects than capacity

◉ Poor visibility of what is being worked on

◉ Poor or no alignment to strategic objectives

One research firm noted that 75 percent of IT organizations have “little oversight of their IT project portfolios and employ nonrepeatable, chaotic planning processes.” Other aspects of IT processes experience similar problems and results. Certainly, if this is the state of the front end of where fundamental IT work is allocated, budgeted and managed, the entire process is set up for downstream failure.

There have been many attempts, under many labels, to fix these problems and issues in IT. Some address the strategic alignment issues while others address specific tactical or functional issues. Although most of these solutions are adequate helpers within their individual spheres of influence, few methodologies have provided the holistic alignment and linkage needed from top to bottom the way a properly orchestrated Lean Six Sigma system does.

IT Best Practices Using Lean Six Sigma

The application of Lean Six Sigma in best-practice companies has consistently provided a roadmap toward higher performance levels in all aspects of IT. IT organizations and CIOs, including those at Bank of America Corp., Sara Lee Corp., National City Corp., Xerox Corp., GE and Seagate Technology LLC, have demonstrated that IT processes can be defined, measured, analyzed, improved and controlled in a way that helps align projects and assures business results – the Lean Six Sigma way.

These companies and others have also successfully deployed the Lean Six Sigma design roadmap, Design for Lean Six Sigma or (DFLSS), to assure effective, efficient and robust designs of their IT solutions.

Sara Lee required all professionals within its IT organization (including strategic IT vendors) to become Lean Six Sigma certified prior to beginning a company-wide SAP AG software implementation. Sara Lee chief information officer (CIO) George Chappelle recently explained to Lean Six Sigma conference attendees that, “We needed to do this so we would be able to see measurable outcomes aligned to the needs of our company and our customers.” It was that data-driven aspect of Lean Six Sigma that enabled Sara Lee’s IT group to gain strategic alignment, quantitative understanding and a high probability of successful business outcomes related to the deployment. DFLSS concepts were used throughout the projects.

Seagate CIO Mark Brewer has relied on Lean Six Sigma since the early 2000s. In a CIO magazine interview, which cited millions of dollars of IT savings, he said, “If I view IT operations as a factory, then Six Sigma applies immediately.” In the same article he discussed a server response problem long thought to be an expensive bandwidth problem. Once Six Sigma was used to measure multiple server response times, and the causes of variation were understood, the problem was found to have nothing to do with bandwidth. The solution was basically free (other than the analysis and some tuning) and large savings were realized.

Further, these organizations have used DFLSS for everything from portfolio management to risk management to software development. By charging the process with better, faster and more-accurate requirements planning, prioritization and analytical tools; accurate measurement systems; and a management process to monitor and adjust their use, DFLSS brings a layer of efficiency, order and alignment to customer needs often missed by other tools and methods.

Some Common Questions


These cases and examples were, for the subject companies, significant breakthroughs from the reactive and chaotic state they were in before Lean Six Sigma brought some consistency, order and methods to the table. Going into Lean Six Sigma, they likely had many questions and concerns.

Q: Does Lean Six Sigma replace everything else going on in an organization?

A: Of course not. Other specific development tools and methods must remain in place to drive function-specific best practices and core work processes. Lean Six Sigma helps glue them together, keeps them data driven, and aligned to customer and company needs. By reducing and eliminating rework and eliminating mistakes and recurring problems, a new layer of efficiency will be realized. Project redundancy and overlap are often discovered through the use of prioritization tools such as analytic hierarchy process (AHP), cause-and-effect diagrams and FMEA (failure mode and effects analysis). The use of these tools is not often taught or advocated in conventional software development or IT standards.

Q: Are Lean Six Sigma resources necessarily incremental?

A: If they are, then something is wrong. Lean Six Sigma resources are supposed to be the “best and brightest” from their respective organizations. Lean Six Sigma projects should be related to the most important and strategic business issues in the organization. These two things should go together. If they do not, then an organization is doing a poor job of resource allocation. Lean Six Sigma helps organize teams, roles and responsibilities around specific projects and issues. Project-selection tools assure alignment and business cases that meet the needs of the company. The only incremental resource is the time required to put employees through training. But even at that, projects are “pulled through” the training process and completed as a function of an employee’s training, often saving more money than the training costs.

Organizational Evaluation


Remarkably, many IT groups argue that they “don’t have time for Lean Six Sigma” because they are working on various initiatives, such as portfolio management, security, information technology infrastructure library (ITIL), capability maturity model integration (CMMi), control objectives for integrated and related technology (COBIT) and project management body of knowledge (PMBoK). When assessing these organizations, findings indicate that the many initiatives often conflict, contend or duplicate each other. This drives them to a reactive state where emotionally charged executives and managers attempt to justify their projects over others on what is usually subjective or anecdotal information. Higher performing organizations, however, realize that Lean Six Sigma does not mean more work. It means doing the existing work in a more efficient, data-driven, planned and prioritized manner. If an IT organization is really interested in becoming more efficient and customer focused, it might help to start by looking inward and devising a plan to drive systemic change based on the organization’s character.

Organizations usually fall into one of three general categories:

1. “Short-sighted and reactive organizations” – Someone at this type of organization might simply say, “Everyone is already too busy with what they have on their plate; we do not have time. Lean Six Sigma is all about statistical methods.” Their methods and data are usually subjective, anecdotal and generalized.

2. “Early learning organizations” – Someone at this type of organization might say, “Our data shows that we have a miserable track record for completing value-added projects on time and on budget. We need to and will change.” They have some level of data use in their decision-making process but prioritization and analytical techniques are not used broadly and consistently. The data may exist but may be poorly organized and inaccurate. Thus, the data may drive invalid conclusions, even if good analytical tools are employed.

3. “High-performing organizations” – These organizations use a method and tools for aligning, prioritizing, measuring and managing project performance. Observations clearly show a common and consistently followed approach that can be quantitatively linked to auditable business results with strong and continuous cycles of evaluation, improvement and innovation (even in iterative, agile processes).

Take the Next Steps


Intuitively, most people know that change, especially when driving an organization from a reactive state to a proactive state, does not happen by mandating a new software tool or demanding everyone work harder. Change comes from a consistent, strategically aligned, rigorous process that is reinforced for the long haul as the organization’s operating system. Many existing standards and methods fall short on this front-end change mechanic. Lean Six Sigma was engineered to address those shortfalls by:

◉ Focusing on facts and data to prioritize and select projects and resources.

◉ Establishing roles, responsibilities and accountabilities driven by performance data.

◉ Linking and aligning business goals to project goals (driving the businesses closer to software and IT functions).

◉ Requiring frequent review of performance data and supporting analysis.

◉ Refusing to accept redundancy, overlap and poorly prioritized projects and resources.

Historically, Lean Six Sigma was created because attempts at using standards such as International Organization for Standard 9000, conventional quality assurance/quality control and other top-down, broad-based initiatives failed to drive the advertised performance results. In analyzing what worked and what did not in these systems, practitioners learned that problem-solving success comes from thinking a problem through and clearly defining it in quantitative terms from the beginning. In today’s fast-paced software and IT world there is tremendous pressure to deliver on time and on budget. This pressure can easily cause organizational behavior to short-circuit the front-end processes (planning, prioritization, requirements and design), resulting in poor resource-management decisions, missed requirements, and higher rework and support costs.

Six Sigma Tutorial and Material, Six Sigma Learning, Six Sigma Guides, Six Sigma Career, Six Sigma Preparation

The following six steps may go a long way to help IT organizations avoid some of these problems:

1. Pay particular attention to the organization’s project selection process; make sure that it is data driven and utilizes some basic prioritization and alignment tools.

2. Be sure that project definition, selection and prioritization is a team sport, especially involving business and external customers.

3. Utilize a complete and common project charter template that clearly states a measurable project metric(s).

4. Follow a common roadmap (such as DMAIC) to assure that all critical success steps and tools are utilized to maximize efficiency and minimize project risk.

5. Conduct frequent data-driven tollgate reviews, focusing not only on milestones and cost, but also on performance data related to functional or specification requirements.

6. Learn form project performance by retaining and reviewing project history, particularly project successes and failures.

The Lean Six Sigma methodology, adopted for use in software and IT, has proven to be a valuable way to drive organizations from the reactive and chaotic state to a more desirable and efficient proactive state. When implemented properly, it helps to provide a much needed process discipline, while recognizing and leveraging other bodies of knowledge including agile, PMBoK, CMMi, ITIL and other important domain-specific processes.