Monday 29 June 2020

Perfect Your Predictions with Yield and Single-Use Reliability Modeling

Six Sigma Tutorial and Materials, Six Sigma Learning, Six Sigma Exam Prep, Six Sigma Guides

Yield is a key parameter in most manufacturing processes – tied to financial results, delivery and quality as shown in Figure 1.

Six Sigma Tutorial and Materials, Six Sigma Learning, Six Sigma Exam Prep, Six Sigma Guides

Figure 1: Yield Tied to Gross Margin and Delivery

Yield modeling allows the team to predict future yield and prioritize opportunities to improve yield. A yield model combines predicted yields for each step of the process into a predicted yield distribution for the entire manufacturing or assembly process.

Single-use reliability or mission reliability is analogous to yield modeling and refers to the overall probability of success, such as the success of a military mission, the launch of a satellite, or the probability of success for a medical procedure. The overall probability of success for the mission or procedure is a combination of the probabilities of success for each step in the mission or procedure, similar to steps in a manufacturing process.

By using either – or both – of these models, you can better prioritize your processes for improvement.

The probability of success for each step of a process, procedure or mission can range between 0 percent to 100 percent, so it can be modeled using a statistical distribution that ranges between 0 percent and 100 percent, such as a beta distribution. The overall probability for success of the process, mission or procedure also can range between 0 percent and 100 percent, and can likewise be represented by a beta distribution. Fortunately, combining the probabilities of success for each step by multiplying beta distributions for each step results in another beta distribution representing the probability of success for the mission, procedure or process.

Beta Distributions

Beta distributions, initially referred to as Pearson type 1 distributions, represent the family of distributions bounded by 0 percent and 100 percent. The beta distribution has two parameters, often referred to as alpha and beta. Insight into the meaning of alpha and beta parameters can be provided by analogy to the Bernoulli and the binomial discrete distributions.

On an individual basis, a part can pass or fail or a step in the process can experience success or failure; this can be represented by the Bernoulli distribution. If there is a set of five parts or five iterations of the process step, this can be represented by the counts of successes among five Bernoulli distributions; the distribution of the numbers of successes among the five Bernoulli distributions will give the same result as a binomial distribution for the counts of the number of successes among a set of five trials. Figure 2 shows the overlay of binomial distribution with probability of success per trial of 50 percent and five trials, compared to the sum of five Bernoulli distribution results each with a probability of success per trial of 50 percent.

Six Sigma Tutorial and Materials, Six Sigma Learning, Six Sigma Exam Prep, Six Sigma Guides

Figure 2: Overlay of Binomial Distribution

If the number of trials is much larger than five, the information will move from discrete counts of successes divided by total attempts and approach a continuous parameter, the probability of success.

Binomial and Beta Probability Equations

By analogy to the related binomial distribution, two parameters of the beta distribution, alpha and beta, reflect the expected number of good parts and bad parts, respectively. The equations of binomial and beta probabilities are as follows.

Binomial probability:

Six Sigma Tutorial and Materials, Six Sigma Learning, Six Sigma Exam Prep, Six Sigma Guides

Where s is the number of successes in n trials
Equation 1

Six Sigma Tutorial and Materials, Six Sigma Learning, Six Sigma Exam Prep, Six Sigma Guides

Equation 2

So, if a step in the process has been tried n number of times, and has succeeded s times and failed f =  n – s times, the probability of success can be estimated by a beta distribution with an alpha parameter of (s + 1) and a beta parameter of (f + 1), described as beta(s + 1, f + 1). This approach provides a useful way to model the probability of success for an individual step in a manufacturing process or mission or procedure using beta distributions.

If the success of a step in the process is based on a continuous parameter rather than a discrete pass/fail parameter, the probability of success can also be converted to a beta distribution. A measure of goodness for the continuous, such as Cpk, z-score or yield can be used to estimate the probability of passing, p. However, estimating the two parameters for a beta distribution require two values, and the probability of passing, p, must be supplemented by a second value.

This second value can be the number of samples, n, or a value for n can be assumed to reflect the degree of uncertainty in the Cpk, z-score or yield from the parameter distribution. Using the previously referenced analogy between the beta and binomial distributions, the variance of yield or single use reliability is variance = p(1 – p)/n. Values for alpha and beta can be estimated from these equations based on the beta-binomial distribution analogy shown in Equations 3 and 4.

Alpha ≈ (p2-p3)/Variance – p
Equation 3

Beta ≈ alpha*(1 – p)/p
Equation 4

Values for the alpha and beta for the probability of success can be estimated for each step – whether based on the actual or predicted numbers of passes and fails for a discrete parameter or the Cpk or z-score or yield for a continuous parameter. An example of this summary is shown in the table below of yield modeling for five process steps, some continuous (Cpk) and some discrete (pass/fail).

Six Sigma Tutorial and Materials, Six Sigma Learning, Six Sigma Exam Prep, Six Sigma Guides

Table 1: Yield Modeling

These values of alpha and beta for each step can be combined into overall probability of success for the overall process, corresponding to the overall yield for a manufacturing process or the probability of success for a procedure or mission, as shown in Figure 3. You can combine the values to use Monte Carlo simulation or another method based on the generation of system moments method. Both methods can provide sensitivity analysis that can help in prioritizing opportunities to improve yield or reliability, as shown in Table 2.

Six Sigma Tutorial and Materials, Six Sigma Learning, Six Sigma Exam Prep, Six Sigma Guides

Figure 3: Combined Distribution for Yield or Single Use/Mission Reliability

Six Sigma Tutorial and Materials, Six Sigma Learning, Six Sigma Exam Prep, Six Sigma Guides

Table 2: Average Yield and Variance Contribution from Each Step of the Process or Procedure

Since the combined distribution is represented by a beta distribution, a lower confidence limit for yield or single-use reliability can be established, as shown in Table 3.

Table 3: Yield or Single Use Reliability at 95% Confidence Using the Cumulative Beta Distribution Function 
LSL confidence interval 95%
Yield at 0.95 confidence   82.9% 

Friday 26 June 2020

Leadership skills for the future

Prince2, Prince2 Study Materials, Prince2 Exam Prep, Prince2 Guides, Prince2 Learning

You may have felt tested in your role in the past few months, but rest assured, you are not alone! Collectively our management skills have been tried, pushed and developed in a crash course. Whilst there is no text book to answer “how to manage during a global pandemic”, you may have found yourself looking back to theory for how to best handle business disruption. You may have also looked to peers and even competitors for strategies and best practice approaches. However, now is the time to look within!

Take a moment to reflect and learn lessons from your own leadership skills during the coronavirus pandemic thus far. A pause of contemplation and self-reflection has the power to set you up to be a better leader going forward. Here are just some of the skills you may well have gained for the future:

Agility and adaptability


Whether you are well-versed in agile project management practices, or the concept is new to you, your agility will have undoubtedly been challenged by COVID-19. Extreme changes on a global level have affected business across the globe. As a manager this means your role will have been encompassed by change navigation. Adaptability has become vital, and there has been pressure for quick action like never before.

Going forward, so much will have been learned from this. It will surely impact the pace of your future decision-making, your ability to react and respond to bumps in the road on any project, and how to navigate through external changes.

Innovation


Innovation goes hand in hand with being agile and adaptable. As you decision-make, pivot and find solutions, you are innovating faster than ever before. Standing still has not been an option for companies during these unprecedented times, and so innovation has been crucial. Whether it has been repurposing existing products, relocating existing talents, finding new ways to deliver, or creating new products and services based on changing demands, or finding new markets.

Embrace this trend and become a team or company unafraid to try new things and continually reinvent, reimagine and create. Innovation will see your company thrive post lockdown. So, make a habit of being aware of shifts in the landscape and attentive to change. Become accustomed to seeing new opportunities and acting upon them.

The personal touch


A huge majority of us have gotten to know our neighbours more during lockdown, and there has been a real sense of community developing worldwide. People are looking out for one another, helping those who are struggling, and on the whole being more friendly and personable; we’re all in this together after all. This collaborative spirit is likely to have reached our work lives too.

As a manager in particular, you are likely to have checked in with your staff more than you would have done previously. In part, this is due to employees working remotely, but also because of the seismic changes which we have all had to deal with – it is always worth checking messages have been received and that individuals are on the right track. The takeaway from this being that you will likely know your team that little bit better on the other side of these testing times. Ensure that two-way communication and your personal touch continues, as it might just make you a better leader.

Positivity


It is key that we look for the positives to take from the COVID-19 situation. Being more personable, innovative and agile going forward is certain to benefit your work life. Further development of each of these traits and soft skills will be key to success. So, reflect on these takeaways, and others too - perhaps you have surprised yourself with how you’ve handled business communications throughout disruption, or ways in which you have lifted team morale. Beyond being prime examples for any future interviews, these success stories should give you the confidence to rise to new challenges. Establishing and advancing these skills could be fundamental in the future of your career as a leader.

Thursday 25 June 2020

Lean Fills Prescription for Change at Hospital Pharmacy

The process improvement journey at Jordan Hospital took a large step forward last year when the organization was introduced to Lean Six Sigma concepts as part of a departmental optimization effort for its internal pharmacy. Jordan Hospital is an acute care, 150-bed, not-for-profit community hospital, serving 12 towns in Plymouth and Barnstable counties in Massachusetts, USA.

Jordan Hospital’s pharmacy is currently undergoing several major changes to improve operations, reduce costs and better serve the needs of customers via the application of Lean principles. The pharmacy, led by John Leone, director of pharmacy, is following Lean’s primary tenets to reduce the time the supplier takes to deliver a customer’s order, and to eliminate wastes (and costs) throughout the system.

The objective for the hospital, according to Russ Averna, leader of the hospital’s Lean program and the vice president of human resources, is to apply Lean principles to improve operations, reduce costs, and better serve the needs of customers. Many other industries, including those that are service related, have adopted Lean approaches to increase their effectiveness and efficiency.

To optimize the transformation to using Lean, the hospital worked with consultants to introduce the change management tools to a broad audience of people from different areas of the hospital. The objective was to identify potential problems surrounding upcoming changes and create actionable plans to mitigate concerns and foster facility-wide acceptance.

Building Consensus for Change


A project team focused on increasing the clinical role of pharmacists to create a new vision of the “pharmacist of the future.” Another team worked on enhancing the communication of all changes within the pharmacy, and planning to optimize the future integration of the oncology pharmacy staff with the oncology department to further improve patient care and reduce drug delivery turnaround time.

In addition to these consensus-building events, the leadership also challenged the pharmacy team to improve the current performance inside its own walls where there were opportunities for improvement, specifically looking at the first-dose process and IV/chemo preparation.

The first step was to understand the current state of the process. This included the development of a value stream map (Figure 1) to identify where there was waste in the process. The value stream map highlighted non-value-added steps, including significant wait times during which medication was not being processed (waiting on quality checks or delivery runs) as well as extensive travel distances for the technicians who had to fetch some medications from outside the immediate work area.

In addition to opportunities to reduce the overall product lead-time by improving the cycle time, travel distance and flow patterns, there was an issue of physical space constraints. This was relevant because space in the pharmacy was extremely tight and congested, with people running into each other while filling patient orders.

Six Sigma Tutorial and Material, Six Sigma Cert Exam, Six Sigma Learning, Six Sigma Prep

Figure 1: Value Stream Map

Rapid Results with Kaizen


The next step was to prepare for a Kaizen improvement activity. Kaizen is a Japanese word that means change for the better, or more commonly, continuous improvement. A Kaizen is a hands-on burst of improvement activity in the actual workspace that occurs during a relatively short period of time – usually three or four days.

A team, which was comprised of those who perform the activities every day, brainstormed improvement approaches, and then tested them on the actual production or service line (referred to as “trystorming”). This method results in rapid recognition of which solutions will work and which will not. The Kaizen team also created plans to sustain the gains once improvements were made, and developed reports to leadership on its actions.

In preparation, management set clear goals for the Kaizen team. The goals focused on creating a standard work environment and implementing an improved replenishment system using Kanban, a Japanese word meaning “sign board” or “signal.” Pharmacy Director John Leone said, “Despite the fact that our environment will change a lot over the next 12 months, there are many areas where we need to improve the process to optimize future changes. We assembled a great team, and we had every expectation they could achieve the targets.”

The first activity was a half-day training session to familiarize the team and attending executives with the Lean process improvement method and the Lean tools that would be used during the week. After the training was completed, the Kaizen began. The initial activity centered on a 5S of the pharmacy (sort, set in order, shine, standardize and sustain). This included evaluating the purpose and value of all supplies and activities in the work areas. This step alone cleared a significant amount of “clutter” from the area, improving visual control and eliminating several safety hazards. The 5S activity freed up an entire rack where medication that was no longer used was being stored.

Six Sigma Tutorial and Material, Six Sigma Cert Exam, Six Sigma Learning, Six Sigma Prep

Figure 2: Pharmacy Area Before and After 5S Activity

Creating and Sustaining Change


The team then split up and focused on the “bug juice” preparation process and on the IV preparation process and replenishment of this area. As soon as the teams agreed on how to approach the individual problem, they went ahead and dove into the “trystorm” phase where they implemented their ideas. The bug juice team quickly identified and implemented a visual aid and a standard process that would increase communication and reduce the amount of “waste” produced due to communication and replenishment issues with the operating room team.

The IV prep team implemented a two-bin replenishment system close to the point where the medications were used. The two-bin system prevents overstocking of material, provides a mechanism to assure first-in-first-out inventory management and supports a much more just-in-time-driven replenishment.

In addition, the workspace for frozen IV preparation was moved from a congested area to a new location in the space that was recovered through the 5S activity. In the newly created space, workers could focus on the delivery quality of this task without being interrupted. The original IV area had no clear organization of inventory near by. The new IV area had point-of-use equipment and frequently used inventory visible.

Six Sigma Tutorial and Material, Six Sigma Cert Exam, Six Sigma Learning, Six Sigma Prep

Figure 3: The Original IV Area and the New IV Area

The benefits for this 3.5-day project included a reduction of approximately 51 miles per year in travel distance for the technicians, a cycle time reduction of about 102 hours per year, plus additional space created in the tight area.

Six Sigma Tutorial and Material, Six Sigma Cert Exam, Six Sigma Learning, Six Sigma Prep

Figure 4: Filling IV Label – Before and After

Also, the “bug juice” improvements will reduce the waste of medication, which, before, was calculated to about $50,000 per year. Additionally, several safety issues were resolved on the spot, making the environment a safer place to work in. The group then created a 30-day follow-up plan to fully implement those changes that could not be completed within the Kaizen event week to assure that full benefits could be calculated and sustained.

The success of the project was credited to the make-up and performance of team members, the support given to the team, the constructive feedback given to the rapid changes, and the methods used to ensure that changes are communicated effectively. “We really emphasized the people side during Kaizen and the other activities. Change is difficult, but making sure we gave every opportunity to participate was key to the positive results we achieved,” Vice President Averna noted

Additional factors included thorough preparation, clear objectives, management support, a can-do and creative mindset, continuous communication with all affected areas, standardization of the improvements, and routine monitoring and tracking of improvements following implementation.

Monday 22 June 2020

3 Ways to Speed Up Data Collection in Financial Service Processes

Six Sigma Tutorial and Material, Six Sigma Learning, Six Sigma Certification, Six Sigma Exam Prep

In any financial service process that is being studied for the first time, it is common for Six Sigma teams to spend one-third to one-half of their project time on data collection alone. It simply takes a lot of time to figure out what data is needed, to develop a reliable data collection process and to analyze the results. Here are three tips that can help teams get a fast start on data collection.

1. Monitor Some Baseline Metrics


Every improvement project will have its own unique data needs, but there are a number of metrics that are useful for determining overall process health, such as:

Work in process (WIP)/Things in process: The amount of work that has entered the process but has not been completed.

Average completion rate: The average number of work items that are completed in a given time period (a day, an hour, etc.).

Demand variation: The amount of fluctuation in the demand for the output of the process. The amount of work that arrives at a given activity is measured in terms of units/day and as an average completion rate per unit. Variation can be used in queuing theory to estimate the resulting delays that this variation causes.

First-pass yield: The percentage of things in process that make it all the way through the process the first time without needing to be fixed or re-handled in some way. First-pass yield is a good overall indicator of how well the process is functioning. It also reflects both Lean and Six Sigma goals: in order to have a high first-pass yield, the process must operate smoothly (i.e., with good process flow) and with few errors.

Approvals or handoffs: Two characteristics almost always seen in slow processes are 1) a lot of approvals before work can be completed or 2) a lot of handoffs back-and-forth between people or groups. In contrast, Lean processes operating at high levels of quality are characterized by many fewer approvals and handoffs. While having low numbers of approvals or handoffs does not guarantee having a Lean process, this is relatively easy data to collect and will almost certainly drop as the process improves.

Defects/Sigma capability: The Sigma level in Six Sigma is, of course, the rate of defects that occur per defect opportunity. The key is to come up with definitions that: 1) everyone in the team will interpret the same way and 2) are consistent with other definitions used in the organization. For example, when filling out a new customer account form, is every keystroke counted as an opportunity for someone to make a mistake? Or is the whole form one “opportunity”? Do typos count the same as omissions? It is best to focus on things that are important to customers. There are a lot of ways that a form, a report or a service can be technically “defective” in some way without it mattering to internal or external customers. For example, perhaps different employees do the work in a slightly different sequence. If “sequence” affects quality as perceived by the customer, then doing the steps in the wrong order is a defect that should be tracked. If sequence does not affect the customer, then there are probably bigger fish to fry elsewhere.

Cycle or lead time: How long it takes for any work item to make it through the process from beginning to end.

Setup, downtime: Any delays or productivity losses that occur when people switch tasks.

Measure these things early in a project, then again once improvements have been made to determine the impact. If the process being measured has a lot of steps and/or a lot of throughput (volume of work), consider measuring on a sample basis at first (e.g., randomly sample key steps).

2. Observe the Process


In the words of Yogi Berra, “You can observe a lot by watching.” There simply is no substitute for impartial observation as a way to confirm what really happens in a process. Impartial observations are critical in identifying waste and inefficiencies built into how work is currently done.

In an office environment, it is hard to observe the work itself, since it can take the form of emails, reports, phone calls or inputs to screens – some work products may exist only in a virtual sense. As a result, process observation in service environments means watching people and what they do. And there is the rub. Not many people like someone sitting at their shoulder, watching their every move.

For that reason, process observation in financial services often works best with trained observers, especially if they are seen as neutral parties (i.e., they come from a different work area, they are a trained Black Belt who has not worked in the area before, etc.). Also, office staff needs to be involved in setting the goals for the observation (“What will be learned from this?”) and in deciding when the observation will happen, which staff will volunteer to be observed, and so on.

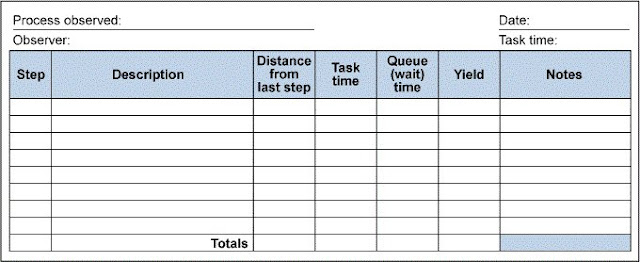
The example below is a form that Lockheed Martin found invaluable in the early stages of improvement projects. It was used for verifying (or refuting) everyone’s ideas about what they think is happening, and for helping them zero-in on areas that need attention.

Six Sigma Tutorial and Material, Six Sigma Learning, Six Sigma Certification, Six Sigma Exam Prep
Example of Form Used for Process Observation

3. Collect Data by Participating in the Process


What better way to evaluate a particular service than by acting as a customer of that service? This can be done most easily by having a selected group of employees physically walk the process pretending to be an item of work – an incoming customer call, for example. What happens to the record of the call? Who works on it next? What happens at that work station? Where does it go after that?

Another approach is shared by Roger Hirt, a Black Belt with the City of Fort Wayne, Ind., who recalls one project where a team wanted to improve the quality of response to citizen calls. Instead of doing an after-the-fact survey of callers, they used secret shoppers, people who interact with the process just as real customers would. First, they provided the secret shoppers with standard scripts relating to different types of inquiry and complaint calls. They had these people call the city department at different times (so they would talk to different staff), then looked at how the staff had handled the calls. They discovered a lot of inconsistency in how staff recorded and categorized information, with the result that citizens weren’t always provided with correct answers or responses. This information allowed the department to develop training for everyone who received calls. A second secret shopper trial showed dramatically improved results.

Collecting data this way is a sensitive issue. On one hand, the idea is to be assured that the secret shoppers are getting service similar to what real customers would experience. But on the other hand, employees may be disturbed if the data collection comes as a complete surprise. Project Black Belts and improvement teams will have to make a judgment call about how much to tell people ahead of time.

Friday 19 June 2020

What Are the Benefits of Lean Six Sigma for My Company?

Six Sigma Tutorial and Material, Six Sigma Learning, Six Sigma Certification, Six Sigma Exam Prep

Lean Six Sigma is a methodology and toolset that combines all the benefits of Six Sigma with those of Lean enterprise, so you can find the right tool for every job. Its aim is to identify and systematically remove defects and waste from every process within a company, organization or entity – in any industry, segment and business size.

Ultimately, the result of using Lean Six Sigma is improved efficiency within the company and a higher quality product or service for the customer. But there are some additional ways your company can benefit.

Financial Benefits


The financial benefits of Lean Six Sigma are large and well documented. Companies dedicated to implementing Lean Six Sigma not only see increased profits by reducing expenses, but can also benefit from an increase in revenue. For example, at North Shore-Long Island Jewish Health System, a radiology throughput project not only helped meet the demands of patients, providers and physicians, but it also generated an additional $375,000 per year in revenue.

Michael Cyger, founder and publisher of iSixSigma, discussed research conducted by his team in “Six Sigma Cost and Savings.” In that research, iSixSigma looked at the hard statistics recorded by Motorola, Allied Signal, GE and Honeywell and discovered that these companies experienced a year-on-year increase in savings and revenue growth, amounting to billions of dollars.

Research by Arvind Rongala of Invensis Learning has also found that enterprises that adhere to the Lean Six Sigma process improvement methodology achieved 40 percent more return on investment, or ROI, than those that didn’t.

Employee Satisfaction Benefits


Six Sigma doesn’t just improve the top and bottom line for your company, which shareholders love. Six Sigma employees themselves attest to improved job satisfaction.

One of the core tenets of Lean Six Sigma is to stop relying on the intuition and gut feel of managers to make the right steps for business operation and growth. Instead, empower every employee to make suggestions by teaching them how to collect and analyze data within their own process at work. They do this by giving them the Lean Six Sigma toolset.

Solving problems then develops confident employees who feel enabled to speak out, challenge the norm and enact real change for their customers and themselves.

At Black & Veatch Corp., a global engineering, consulting and construction company, human resource leaders found the causes of employee turnover and fixed their on-boarding process, reducing first-year voluntary turnover and eliminating $500,000 per year in costs.

Company Culture Benefits


The benefits earned by employees are not one off – they are cumulative.

Lean Six Sigma also has a follow-on effect as trained Green and Black Belts share their knowledge and reasoning with their colleagues in their current positions and as they rise up the ranks within their company and oversee their own teams.

Implemented correctly, with an awareness of the needs that motivate individuals and teams, Lean Six Sigma optimizes individual and team performance, which manifests itself in a culture of continuous improvement throughout the company.

Decrease in Error Benefits 


It’s often hard for employees to diagnose the root cause of a problem within a company and – as a result – time, energy and resources are wasted making superficial changes.

Lean Six Sigma simplifies processes by facilitating deep investigation and process understanding so that employees can root out the real issue that is causing customer-perceptible defects. Lean Six Sigma empowers your employees to take charge of improving their areas of expertise, and it gives them the skills to analyze data, identify problems and help to create effective solutions.

Satisfied Customer Benefits


If Lean Six Sigma is done properly, it starts with the customer and ends with the customer. The upper and lower specification levels for every product or service that the customer receives are determined, so the company can determine how well it is performing. If a company is out of specification, they know exactly what to work on to improve their processes and delight the customer.

Fewer customer complaints leads to fewer customer service inquiries, which leads to less rework to fix problems and bureaucracy to oversee the rework. It is well established that customer satisfaction leads to customer loyalty, which in turn influences the financial performance of the company.

Benefits of Lean Six Sigma to Your Company


The potential benefits for a company that embarks on a Lean Six Sigma initiative make it a worthwhile investment.

Though you can start to see results from the first year, the financial benefits grow as employees experience a culture change and take initiative to identify and eliminate waste.

And while Lean Six Sigma is not easy to implement, it is a competitive advantage for every organization – and an organization’s staff, customers and stakeholders will reap the benefits.

Wednesday 17 June 2020

SIPOC Diagram

Six Sigma Tutorial and Material, Six Sigma Learning, Six Sigma Certification, Six Sigma Exam Prep

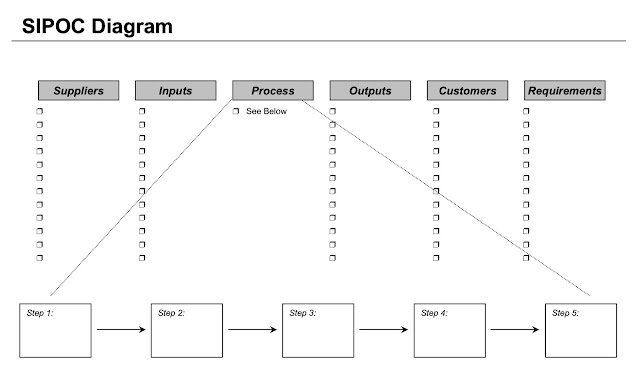
Many recent inquiries and discussions have focused on the SIPOC diagram – a tool used in the Six Sigma methodology. Because of the interest level, a further explanation is presented here along with a sample and template for your use.

A SIPOC diagram is a tool used by a team to identify all relevant elements of a process improvement project before work begins. It helps define a complex project that may not be well scoped, and is typically employed at the Measure phase of the Six Sigma DMAIC (Define, Measure, Analyze, Improve, Control) methodology. It is similar and related to process mapping and ‘in/out of scope’ tools, but provides additional detail.

The tool name prompts the team to consider the suppliers (the ‘s’ in SIPOC) of your process, the inputs (the ‘i’) to the process, the process (the ‘p’) your team is improving, the outputs (the ‘o’) of the process, and the customers (the ‘c’) that receive the process outputs. In some cases, requirements of the customers can be appended to the end of the SIPOC for further detail.

The SIPOC tool is particularly useful when it is not clear:

◉ Who supplies inputs to the process?

◉ What specifications are placed on the inputs?

◉ Who are the true customers of the process?

◉ What are the requirements of the customers?

Sample SIPOC Diagram


A SIPOC diagram is a tool used by a team to identify all relevant elements of a process improvement project before work begins. It helps define a complex project that may not be well scoped, and is typically employed at the Measure phase of the Six Sigma DMAIC methodology.

Six Sigma Tutorial and Material, Six Sigma Learning, Six Sigma Certification, Six Sigma Exam Prep

Steps to Complete the SIPOC Diagram


SIPOC diagrams are very easy to complete. Here are the steps you should follow:

1. Create an area that will allow the team to post additions to the SIPOC diagram. This could be a transparancy (to be projected by an overhead) made of the provided template, flip charts with headings (S-I-P-O-C) written on each, or headings written on post-it notes posted to a wall.

2. Begin with the process. Map it in four to five high level steps.

3. Identify the outputs of this process.

4. Identify the customers that will receive the outputs of this process.

5. Identify the inputs required for the process to function properly.

6. Identify the suppliers of the inputs that are required by the process.

7. Optional: Identify the preliminary requirements of the customers. This will be verified during a later step of the Six Sigma measurement phase.

8. Discuss with project sponsor, Champion and other involved stakeholders for verification.

SIPOC Templates


The following SIPOC templates are for immediate download and use. The Adobe Acrobat version allows you to print and input your SIPOC information by hand, perhaps by overhead. The Microsoft PowerPoint version allows you to input your SIPOC information and print.

Adobe Acrobat (.PDF)

Microsoft PowerPoint (.PPT)

Monday 15 June 2020

Use Pareto Tables to Manage Large Data Sets

Six Sigma Tutorial and Material, Six Sigma Learning, Six Sigma Certification, Six Sigma Exam Prep

Pareto analysis is an excellent way to find the most compelling drivers or root causes of a problem you want to solve. A Pareto chart generally looks like Figure 1 below, which can be easily generated by any number of charting tools, such as Microsoft Excel.

Six Sigma Tutorial and Material, Six Sigma Learning, Six Sigma Certification, Six Sigma Exam Prep

Figure 1: Pareto Chart of Root Causes of Failure for Process X

Challenges of a Pareto Chart


With some large data sets, however, there may be a large number of categories or root causes, making the display of these root causes in a chart form difficult. A Pareto chart format is not always feasible. For example, a service desk may create incident tickets for every incident and call that comes in. For each of these tickets, the fix agents will categorize them using a category, sub-category and even a further breakdown of the sub-category. If they wish to perform a Pareto analysis of all combined categorizations of incidents, they could have several hundred groupings. A Pareto chart of this data would not fit on a single page.

Enter the Pareto Table


One easy and highly visible alternative to the Pareto chart is to use a Pareto table. A Pareto table houses the same data as a Pareto chart but can display several hundreds or even thousands of rows of categories. Analysts can see at a glance which items are the primary drivers and can develop improvement plans to address the most impactful culprits. The following is a real-world example of a Pareto table, using service desk ticketing data (category names modified for data protection purposes).

With the category, sub-category and configuration items combined, the Pareto table has 626 groupings. The analyst collated the three levels using a concatenate function in Excel. He then created a pivot table that tabulated the groupings that drove the most tickets. Only a few rows from the top and bottom of the table are displayed below. You can see by looking at the first few rows that the first twenty of the 626 groupings represent over 80 percent of the nearly 35,000 tickets.

Six Sigma Tutorial and Material, Six Sigma Learning, Six Sigma Certification, Six Sigma Exam Prep
Pareto Table for Service Desk Ticketing

7 Steps to Creating a Pareto Table


There are seven steps you need to take to create a pareto table for large data sets.

1. Collect data. Gather the data from a ticketing system, data warehouse, etc. The data may come in many formats.

2. Identify groupings/root causes to measure. The data may have a field that contains the explicit grouping to analyze. However, an analyst may wish to combine data elements to reveal more compelling aspects of the data, like the combining of category and sub-category referenced above.

3. Create a pivot table of counts by grouping/root cause.

4. Sort the pivot table from highest count to lowest.

5. Identify the total count of data items. For example, in the case of service desk tickets, the total count of data items is the total count of tickets (34,967) – each of which has a combined category, sub-category and configuration item.

6. Calculate the percent of total tickets each grouping represents. Use the following formula:

Six Sigma Tutorial and Material, Six Sigma Learning, Six Sigma Certification, Six Sigma Exam Prep

7. Calculate the cumulative percentage. This is the sum of the individual percentages from the first row in the Pareto table through the current row in the table.

Seven steps are all it takes to complete a Pareto table and get a rapid view of the most compelling drivers of your data. An analyst can perform these steps using any number of spreadsheet tools.

What a Pareto Table Tells You


Once the information is visible in this format, the Pareto table clarifies many mysteries housed in the data. Teams can quickly see which items of focus will bring the most value to the improvement efforts. For instance, in the example of the ticketing system from the table above, if teams focused on the top six items (only 1 percent of the total tickets) and made a 50 percent improvement to those six groupings they would reduce the total ticket count by over 30 percent (from 35,000 to 24,000) for future periods.

A Pareto table is an ideal tool in the Measure and Analyze phases of a Six Sigma DMAIC (Define, Measure, Analyze, Improve, Control) project as it helps teams to quickly ascertain primary drivers. It is also extremely useful in the Control phase. Teams may wish to perform a monthly Pareto analysis to ensure improvements remain. Groups may even want to write some automation to dynamically generate a Pareto table and send auto-notifications when categories are out of the desired range.

Next time you encounter large data sets with many groupings, try using a Pareto table to quickly analyze the data and see what serendipitous revelations come to light. You may be pleasantly surprised with the enigmas you unravel with this rapid data-slicing tool.

Friday 12 June 2020

PRINCE2® vs Agile or PRINCE2 Agile®?

PRINCE2, Agile, PRINCE2 Agile, Prince2 Exam Prep, Prince2 Tutorial and Materials

There's a lot of confusion between PRINCE2 and agile methods, and indeed debate (PRINCE2 vs Agile) about which should be used on projects. In fact, both can and are being used increasingly on projects – often together.

In 2015, AXELOS, the owners of PRINCE2 launched PRINCE2 Agile. PRINCE2 Agile is an attempt to get the best of both worlds – the structure and governance of PRINCE2, combined with the flexibility of agile.

This article compares PRINCE2 and agile methods and approaches and explains how PRINCE2 Agile can bridge the gap between the two.

PRINCE2 vs agile


PRINCE2

PRINCE2 is the world's most widely used project management methodology. PRINCE2 qualifications are a standard feature of project management job specifications in the UK and have grown in popularity since PRINCE2 was launched in 1996.

Currently, over 150,000 PRINCE2 exams are sat somewhere in the world every year.

Agile

‘Agile’ is an umbrella term used to refer to numerous product development methods, frameworks and techniques used by development teams.

Agile approaches emerged from the software industry in the 1990’s, to try to overcome many of the problems which had beset traditional software projects, namely: late delivery, over budget, and low quality.

There are many different agile approaches, the most famous being Scrum, Kanban, Extreme Programming, and Lean. All agile approaches are based upon the 12 agile principles.

Who is PRINCE2 for?


PRINCE2 is a customer-focused project management methodology. It offers a set of principles, themes and processes to enable an organisation’s key managers to justify a project. It helps them understand “why should we do it (the project)?” and “are the benefits worth the costs and risks of doing the project?”. It also focuses on how to manage a project effectively to ensure it remains a worthwhile investment in a changing business environment.

PRINCE2 was developed by the UK government in 1996 as a generic project management methodology.

Focus of PRINCE2


Principles

PRINCE2 is based upon a set of 7 principles which guide all aspects of the methodology.

Since it is a project management methodology, it describes the roles and responsibilities of all members of the project management team. This includes higher levels such as the project board, as well as the project manager and team manager roles.

Themes

It also covers a wide range of key project management themes – business case, organization, change, risk, planning, quality and progress. Success on a PRINCE2 project is measured by how well it enables the benefits to be realized by the customer organization.

Processes

PRINCE2 also includes a full project management lifecycle which explains which role is responsible for taking key decisions at crucial times during a project.

PRINCE2 recognizes that on projects there are all kinds of products (outputs) which are produced by teams of people with various specialist skills. These teams have myriad ways of working and PRINCE2 does not attempt to guide how they should work.

Instead, PRINCE2 simply defines the interface between the project and these teams in terms of reporting, accountability and the work to be done.

Who is agile for?


History of agile

Agile approaches were developed by engineers in the software industry in the 1990s when trying to address problems with software projects being consistently late, over-budget or delivering low quality software.

Agile approaches are now increasingly being used in industries besides the software industry.

Focus of agile

Agile approaches don’t concern themselves with the wider questions about whether a project is worth it, or whether the benefits can be realized afterwards. They do focus however on delivering value to the customer by delivering products incrementally, in the most efficient manner possible.

These products are likely to do what the user/customer needs because the customers have been involved in a constant cycle of defining and prioritizing requirements, developing, testing and providing feedback.

Delivery of working products

Agile methods are aimed at the teams doing the work - whether part of a project or not. They focus on questions for the team such as ‘what needs to be delivered next week?’, and ‘is the working software what the customer needs?’

Collaboration

One of the agile principles is that people on teams must work together collaboratively with the customer. This is done by defining and prioritizing requirements, developing, testing and providing feedback in a continuous and repetitive cycle of iterations. Often, the customer will be co-located with the development team.

Self-organisation

Self-organisation by teams is also one of the agile principles. Agile teams determine their own tools and techniques to use (e.g. task backlogs, burn-down charts, Kanban boards), rather than these being mandated by a project manager.

Comparing PRINCE2 and agile


Planning

One key difference between PRINCE2 and Agile methods is that PRINCE2 is often described as a predictive (plan-based) approach, while Agile calls for short-term, incremental achievements independent of an over-arching plan (the adaptive approach).

This means that, while PRINCE2 enables the customer to remain focused on the project’s original business goals, Agile approaches are very responsive to changes in the project environment and customer requirements.

Agile approaches operate on the assumption that the development process is (predictably) unpredictable. They encourage complete transparency, close collaboration and frequent delivery of usable sub-products that will eventually contribute to the final product delivered.

Levels of plan

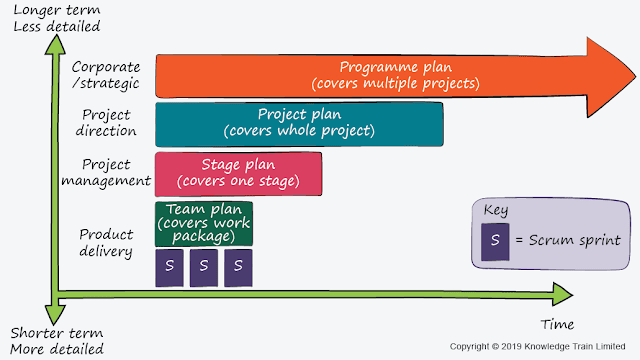
PRINCE2 has the concept of ‘levels of plan’. This suggests that different plans are required by different levels of the project management team. There are 3 levels of plan in PRINCE2:

◉ Long-term – this is a high-level project plan which is required by the key decision-makers (the project board);

◉ Medium-term – this is a stage plan required by the project manager for every stage of the project;

◉ Short-term – this is a team plan required by each team manager (leader) to cover the work done by their team. This is a detailed plan.

Sprints and timeboxing

Agile approaches such as Scrum, take this concept even further by suggesting a detailed plan for each ‘sprint’. A Scrum sprint is based upon the key Agile concept of a ‘time-box’ - a fixed time period typically ranging from between 1-4 weeks.

Delivering working products

At the end of every Scrum sprint a delivery of working software is made to the customer. Delivering working software at the end of each sprint guarantees that the software will never be delivered late.

The customer receives ever increasing increments of working software until, at the end of the final sprint, they receive the fully built and tested system.

Time-boxes and team plans

The agile concept of time-boxes or iterations fits in neatly with PRINCE2’s concept of a team plan because there can be one or more time-boxes within a team plan.

PRINCE2 doesn’t prescribe how many time-boxes a team plan should contain because that’s a decision for the self-organizing Agile team members.

Responding to change


Cost of change

One criticism of more predictive project management approaches is that it is difficult and costly to manage changes. Changes are managed through formal change control processes, and decisions taken by a change authority.

In agile approaches, changes can be done quickly. This is because customer requirements (e.g. software features) are described by the customer in the form of tasks which are prioritised in a backlog.

Because planning is never done further in advance than the next iteration (1-4 weeks usually), tasks can be quickly re-assigned a different priority, new tasks added, or unnecessary tasks removed.

PRINCE2 doesn’t have to be waterfall

There is a perception (wrong in my view) that PRINCE2 struggles to adapt to changing business requirements.

This view is based upon the assumption that PRINCE2 is a project ‘waterfall’ approach. A waterfall approach is where requirements are documented and approved before moving to a design phase, followed by a build phase and finally a testing phase.

There is nothing in PRINCE2 which prescribes such a waterfall approach. In fact, the latest PRINCE2 manual (2017) assumes that on many projects, requirements emerge and evolve as the project continues.

PRINCE2 manages such changes to project scope using its change control approach. However, lower level changes, such as a feature requests can easily be managed at the team level using the prioritization techniques common in agile approaches.

Using both PRINCE2 and Agile


The best of both worlds

Whereas PRINCE2 focuses on understanding what products are required to support the business needs, agile focuses on completing those products in an efficient manner, incrementally delivering more working software (products) as the work progresses.

Utilizing agile approaches on PRINCE2 projects therefore can bring the best of both worlds – the structure and direction of PRINCE2, coupled with the flexibility and responsiveness of agile.

PRINCE2 isn’t concerned with how teams organize or the methods they use. It does however define a simple interface between the customer organisation which is paying for the project and the supplier organisation which provides the teams to do the specialist work.

Business focus and timely delivery

This therefore means that teams on a PRINCE2 project can use any development approach they choose – including any of the agile approaches. Providing they comply with the interface defined by PRINCE2, teams can utilize the benefits of agile (such as on-time delivery), whilst the customer maintains the benefits of PRINCE2’s focus on the business justification.

Quick comparision of PRINCE2 and agile

PRINCE2 Agile methods
Useful for the customer to justify a project   Useful for the supplier to deliver working software
Focuses on higher management levels   Focuses on lower-level teams 
Answers questions such as “should we do the project?” and “are the benefits worth the costs and risk?”   Answers questions such as “what do we deliver next week?” “how will we know it (a product) is finished?”
More predictive approach   More adaptive approach 

PRINCE2 Agile


In 2015, in recognition that many people were struggling to find a way of applying PRINCE2 on agile projects, AXELOS launched PRINCE2 Agile.

PRINCE2 Agile at its core is essentially the same as PRINCE2. They both rely upon the exact same principles, themes and processes. The only real difference is that the PRINCE2 Agile guidance explains in detail how to tailor these elements for agile projects.

Fix or flex?

In particular, PRINCE2 Agile explains what to ‘fix or flex’ for the 6 performance targets of PRINCE2 (time, cost, quality, scope, risks, benefits).

For PRINCE2 Agile, time and cost are fixed. These cannot change. However, in order to be able to deliver what the customer truly needs, scope and products’ quality criteria can be flexed.

What to flex has to be agreed with the customer. Typically, this is done using Agile prioritization techniques such as MoSCoW, coupled with sprint backlogs.

The other 2 performance targets (benefits and risk) may be either fixed or flexed depending upon the customer’s needs.

Source: knowledgetrain.co.uk

Wednesday 10 June 2020

Change Enablement in ITIL 4

ITIL Tutorial and Material, ITIL Guides, ITIL Learning, ITIL Certifications, ITIL Exam Prep

Change enablement is a very critical service management practice within ITIL. It is here that we can introduce improvements in services as well as other service management practices.

A change is defined as the addition, modification, or removal of anything that could have a direct or indirect effect on services.

This would typically include changes to IT infrastructure, applications, documentation, processes, supplier relationships, and any other critical components of the service. Although some IT organizations limit their focus only to hardware and software change enablement, it is important to remember that other elements play significant roles in service development and delivery, and changes to them can negatively impact customers.

What is change enablement?


The purpose of the change enablement practice is to maximize the number of successful IT changes by ensuring that risks have been properly assessed, authorizing changes to proceed, and managing the change schedule.

The distinction between change enablement and organizational change management is important. While organizational change management manages the people aspects of changes to ensure that improvements and organizational transformation initiatives are implemented successfully, change enablement usually focuses on changes in products and services.

Change types


In ITIL, we usually identify three types of change that are each managed in different ways i.e. standard, normal and emergency changes.

Standard change
  • A low-risk, pre-authorized change that is well understood and fully documented, and can be implemented without needing additional authorization.
  • Is often initiated as a service request, but may also be an operational change.
  • Requires a full risk assessment and authorization only during creation, or modification due to business change or occurrence of an incident. 
Normal change
  • A change that needs to be scheduled, assessed, and authorized following a standard process.
  • Involves change models based on the type of change determine the roles for assessment and authorization i.e. low level changes require local (team or supervisor) authorization while high level changes may require board level authorization.
  • Initiation is triggered by the creation of a manual or automated change request. 
Emergency change
  • A change that must be implemented as soon as possible without strictly following the standard process e.g. to resolve an incident or implement a security patch.
  • The process for assessment and authorization is expedited to ensure quick implementation, so scheduling and documentation is not a priority.
  • The change authority may be separate from what is standard or normal practice, typically smaller in number but with greater capacity to expedite approval. 

Change authority


The change authority is defined as a person or group who authorizes a change. This can be a team, supervisor, manager, CEO, board, customer or regulator depending on the nature of the change as well as the organizational approach and culture. It is essential that the correct change authority is assigned to each type of change to ensure that change enablement is both efficient and effective. There is no point constituting a board to review every relatively low risk change that can be locally approved.

In high-velocity organizations, it is a common practice to decentralize change approval, making peer review a top predictor of high performance. For example, an agile product team would make decisions on which elements of the product backlog will be tackled in a sprint, while the agile product manager would make decisions on which customer requirements would be included into the product backlog. Organizations adopting DevOps practices might establish systemic approval based on the success of automated checks in the continuous integration/continuous deployment (CI/CD) pipeline.

Change communication


Regardless of who the change authority is, they may need to communicate widely across the organization as well as to key stakeholders. It is important to prepare all persons involved and all persons affected in advance to prevent surprises. Good communication with the Service Desk, for example, may be important to ensure that high call volumes do not come as an unmanageable surprise following a change that went wrong. Marketing teams might wish to avoid planned campaign activity at a time when key systems are expected to be unavailable. Good communication is also particularly important where a large cross-section of persons with specialist knowledge are needed, for example when assessing the risk of a complex change.

The change schedule is used to help plan changes, assist in communication, avoid conflicts, and assign resources. It can also be used after changes have been deployed to provide information needed for incident management, problem management, and improvement planning. It is important to expose the change schedule to all key stakeholders involved in the changes, through communication channels which are likely to get the message to them in a timely manner.

Contribution of change enablement to the Service Value Chain


The change enablement practice is involved in all the activities of the service value chain as shown below:

Plan Changes to product and service portfolios, policies, and practices all require a certain level of control, and the change enablement practice is used to provide it. 
Engage  Customers and users may need to be consulted or informed about changes, depending on the nature of the change.
Design and Transition Many changes are initiated as a result of new or changed services. Change enablement activity is a major contributor to transition. 
Obtain/Build  Changes to components are subject to change enablement, whether they are built in house or obtained from suppliers. 
Deliver and Support Changes may have an impact on delivery and support, and information about changes must be communicated to personnel who carry out this value chain activity. These people may also play a part in assessing and authorizing changes. 
Improve Many improvements will require changes to be made, and these should be assessed and authorized in the same way as all other changes. 

ITIL Tutorial and Material, ITIL Guides, ITIL Learning, ITIL Certifications, ITIL Exam Prep

Source: bmc.com

Monday 8 June 2020

8 Basics of Lean Six Sigma for Manufacturing Firms

Six Sigma Tutorial and Material, Six Sigma Learning, Six Sigma Certification, Six Sigma Exam Prep

In the efforts to draw closer to customers, many manufacturers have lost focus on what should be a company’s primary success factor – profitable growth. In today’s competitive manufacturing environment, it takes more than quick fixes, outsourcing and downsizing for companies to consistently achieve their growth and profit objectives. While these options may yield temporary financial relief, they will not lead the way to long-term growth and profitability. For companies to grow and consistently exceed bottom line expectations, they need to get lean. And to get lean they should master eight basics of Lean Six Sigma.

Software as the Solution


Companies were led to believe that computerized systems would provide the solution to all growth and profit challenges. Material requirements planning (MRP) and enterprise resource planning (ERP) system gurus assured organizations that if that implemented their software programs the bottom line would take care of itself. Well it did not happen. Like most perceived panaceas, each of these programs received a lot of hype, but, in general, contributed little toward helping companies identify and achieve their full growth and profit potential.

For a measure of their shortcomings, one needs only to spend some time in an MRP scheduled manufacturing facility – especially during the last weeks of the final financial quarter. In a typical company, converting the quarterly financial forecast into reality still requires overtime, internal/external expediting, last minute on-the-run product changes and even some smoke and mirrors from time to time. Results are scrap, rework and warranty costs that negatively impact profitability and quality, and shipment problems that deliver less than acceptable customer satisfaction. Companies have spent many thousands of dollars in pursuing MRP and ERP only to see growth and profits decline due to uncontrolled operating costs that produced non-competitive pricing.

So, after introducing such computer systems, why is it that many businesses are still struggling to sustain profitable growth and are not close to achieving their full growth and profit potential? The first reason is simple – the results achieved by any computer system are only as good as the people at the controls and the integrity of the data they provide. The second is more complex – most manufacturing managers facing major day-to-day problems and constraints adopt a totally reactive management style. Consequently, their time is consumed applying Band-Aids and/or finding ways to work around system and process problems. That leaves them little or no time to analyze and eliminate the root causes of ineffective systems and processes.

How to Get to Root Causes


How does one turn around such a classic cart-before-the-horse situation? What is required first is a company-wide, in-depth understanding of the fundamentals of Six Sigma and then a total commitment to the consistent and tenacious execution of eight basics of Lean Six Sigma.

Like renowned football coach Vince Lombardi, who achieved success by having his team focus on the mastery of football basics, manufacturing teams need to focus on the mastery of the Lean manufacturing basics. These basics require proactive planning and tenacious execution that demands leadership above and beyond just satisfying day-to-day accountabilities. Some managers cannot envision the benefits of mastering manufacturing basics. Others simply cannot find the time. Like practicing blocking and tackling in football, it is not exciting. And like most football heroes, managers prefer to run with the ball. But without the solid execution of Lean Six Sigma basics, companies will seldom achieve their full growth and profit potentials. Here are the eight basics of Lean Six Sigma which every manager should know and implement:

1. Information Integrity: It is not uncommon for front office management to become disenchanted with computerized systems results when time schedules and promised paybacks are not achieved. It is a given that acceptable systems results cannot be achieved when systems are driven by inaccurate data and untimely, uncontrolled documentation.

2. Performance Management: Measurement systems can be motivational or de-motivational. The individual goal-setting of the 1980s is a good example of de-motivational measurement – it tested one individual or group against the other and while satisfying some individual egos, it provided little contribution to overall company growth and profit. Today, the balanced scorecard is the choice of business winners.

3. Sequential Production: It takes more than systems sophistication for manufacturing companies to gain control of factory operations. To achieve on-time shipments at healthy profit margins, companies need to replace obsolete shop scheduling methodology with the simplicity of sequential production. Manufacturing leaders have replaced their shop order “launch and expedite” methodology with continuous production lines that are supported by real-time, visual material supply chains…sequential production. The assertion that sequential production only works in high production, widget-manufacturing environments is a myth.

4. Point-of-Use Logistics: Material handling and storage are two of manufacturing’s high cost, non-value-added activities. The elimination of the stock room, as it is known today, should be a strategic objective of all manufacturers. Moving production parts and components from the stockroom to their production point of use is truly a return to basics and a significant cost reducer.

5. Cycle Time Management: Long cycle times are symptoms of poor manufacturing performance and high non-value-added costs. Manufacturers need to focus on the continuous reduction of all cycle times. Achieving success requires a specific management style that focuses on root causes and proactive problem solving, rather than fire-fighting.

6. Production Linearity: Companies will never achieve their full profit potential if they produce more than 25 percent of their monthly shipment plan in the last week of the month or more than 33 percent of their quarterly shipment plan in the last month of the quarter. How linear does a production department produce to the company’s master schedule? As companies struggle to remain competitive, one of the strategies by which gains in speed, quality and costs can be achieved is to form teams of employees to pursue and achieve linear production.

7. Resource Planning: One of the major challenges in industry today is the timely right sizing of operations. Profit margins can be eroded by not taking timely downsizing actions, and market windows can be missed and customers lost by not upsizing the direct labor force in a timely manner. These actions demand timely, tough decisions that require accurate, well-timed and reliable resource information.

8. Customer Satisfaction: Customer satisfaction is in the eyes of – surprise! – the customer. Perceptions are what a company needs to address when it comes to improving customer satisfaction. It does no good to have the best products and services if the customer’s perception of “as received” quality and service is unsatisfactory. Companies need to plan and implement proactive projects that breakdown the communication barriers that create invalid customer perceptions.

Answer Is in Six Sigma Basics


While many business gurus may have identified one or more of these Six Sigma basics as important to the successful pursuit of business excellence, the fundamental importance of these basics seems to have been lost in the proliferation of buzz words and the mania of systems sophistication. It is time for companies to put a hold on sophisticated systems development that cause self-inflicted, day-to-day chaos. In its place, they should initiate an action learning program for gaining a company-wide understanding and acceptance of the importance of the basics of Six Sigma. Once buy-in and commitment have been achieved, aggressive planning and tenacious implementation must follow. In short, that is putting “horse in front of the cart.” And such a program will build a solid foundation for redefining and revitalizing a company’s pursuit of profitable growth.