Wednesday, 10 March 2021

Using Lean Six Sigma Measurement Tools in Maintenance

Six Sigma Tutorial and Material, Six Sigma Certification, Six Sigma Learning, Six Sigma Preparation

Lean Six Sigma is widely used in production, but it is just now breaking the surface in maintenance functions. Driving change in maintenance operations is a difficult task. Most maintenance personnel are taught on the job or learn their own techniques during the course of several years. Their experience in breakdown situations, which require them to make quick repairs to get equipment back up and running, leads them to make changes without fully scoping the problem or using data to make decisions.

This creates the challenge: How does a company implement a measurement system using data to identify root causes, prioritize workloads and drive improvements in a maintenance operation?

Although most medium to large companies have a computerized maintenance management software (CMMS) system, many do not take the time to utilize the information for maintenance improvement. The information is merely used as an accounting tool for maintenance charges. Most CMMS systems have a recording tool capable of tracking downtime information with a reason code; however, this field is rarely used. To begin to solve maintenance issues, the leader of the organization must enforce proper use of the CMMS system. The data will help:

◉ Identify the largest opportunities within the organization

◉ Develop the mean time between failures for all critical equipment

◉ Identify the root causes of breakdown occurrences

Proper use of maintenance metrics within the CMMS system is essential to the success of any maintenance department and should include the following metrics:

◉ Downtime metrics on all critical equipment (Downtime is defined as anytime equipment is scheduled for production yet not producing product.)

◉ Reason for each downtime event

◉ Overtime by trade

◉ Project status on all in-process and future projects

◉ Work order backlog status

◉ Percent scheduled work to total work orders

◉ Critical spares inventory and turns information

In companies where a CMMS system does not exist, an effective system that uses paper-based data collection techniques is an acceptable alternative. Start with a general ledger at each critical piece of equipment, ensuring that the ledger is connected to a workstation at the equipment. Maintenance employees should record work performed at the machine using data metrics such as:

◉ Downtime event date, start and end time, equipment number or name

◉ Reason for downtime

◉ Name of maintenance technician

◉ Summary of repair

◉ Parts used on repair

◉ Whether the event was scheduled or unscheduled

Once per week, compile the information from each critical machine to generate a summary of the maintenance performance. The report should include a Pareto chart of total downtime by each piece of critical equipment, downtime reasons for each piece of equipment, mean time between failures calculated for each piece of critical equipment and a downtime trend chart for each critical operation, as illustrated in the figure below.

Six Sigma Tutorial and Material, Six Sigma Certification, Six Sigma Learning, Six Sigma Preparation

Implement a weekly summary maintenance meeting for the site with the maintenance personnel that perform work on the equipment, maintenance planners and supervisors. During the meeting, maintenance employees in charge of designated areas should present the data and reports for their areas. The combined data enables the maintenance team to successfully identify areas of opportunity and plan for future improvements.

When used correctly, Lean Six Sigma measurement tools are effective in identifying improvement opportunities for maintenance organizations.

Tuesday, 9 March 2021

Comparing and Blending ISO9000 and Lean Six Sigma

ISO 9000, Lean Six Sigma, Six Sigma Exam Prep, Six Sigma Preparation, Six Sigma Certification, Six Sigma Guides, Six Sigma Career

During recent decades, a number of different methodologies have evolved to help organizations improve quality, speed and efficiency, and better serve their customers. Manufacturing businesses have concentrated primarily on the ISO system, a series of increasingly tough manufacturing benchmarks and requirements developed by the International Standards Organization, and Lean manufacturing (originally known as the Toyota Production System), which focuses on process speed and the elimination of waste. ISO also has been used in the services arena, although service businesses have been more likely to use various process improvement systems, starting with Total Quality Management in the 1980s and evolving into Six Sigma in the 1990s.

Though each of these methodologies was originally viewed as distinct from the others, businesses are now coming to see that there are valuable synergies between them. Many service organizations, for example, have already begun to blend the higher quality of Six Sigma with the efficiency of Lean into “Lean Six Sigma.” The comparison of Lean Six Sigma to ISO9000 standards and the exploration of how the two can be blended for maximum effect start with a review of both disciplines.

What Is ISO9000?

ISO9000 is a series of international standards that identify the minimum activities that a company must have in place in order to control quality. An ISO9000 Quality Management System is a framework that includes systematic methods, documented processes and defined responsibilities. The system should encompass:

◉ A quality system that describes how the company fulfills the requirements for each element of a given standard.

◉ Practices consistent with documented quality policies and procedures.

◉ Maintenance of quality records.

◉ Performance of regular quality audits.

ISO9000 can serve as a platform for continuous improvement by:

◉ Establishing baselines to measure and evaluate changes and improvements.

◉ Clarifying customer and supplier quality requirements and accountability.

◉ Improving staff understanding of factors in their control that affect quality, and renew commitment to providing quality service.

◉ Facilitating the exchange of technical and practical information both vertically in the hierarchy and peer-to-peer.

◉ Facilitating the training and cross-training through improved documentation.

◉ Increasing effectiveness of internal, customer, supplier and regulatory communications through defined and documented responsibilities and interfaces.

◉ Establishing the means for systematic improvement and renewal through formal corrective/preventative action and internal audits.

What Is Lean Six Sigma?

Lean and Six Sigma is the combination of two tool kits around process improvement that are essential to success in a company. Lean deals with improving the speed of a process by reducing waste and eliminating non-value added steps. Six Sigma improves performance by focusing on those aspects of a process that are critical to quality from the customer perspective and eliminating variation in that process.

Lean utilizes “Kaizen events” – intensive, typically week-long improvement sessions – to quickly identify improvement opportunities and goes one step further than a tradition process map in its use of value stream mapping. Six Sigma uses a formal project methodology known as DMAIC (Define, Measure, Analyze, Improve, Control) to allow project efforts to bring measurable and repeatable results.

Additionally, management engagement and dedicated Champions and Black Belts assure that the prioritized projects are executed as part of a way of doing business. The project benefit matrix process helps identify those most critical projects that will have the largest impact to the bottom-line and can be accomplished the fastest.

Both Lean and Six Sigma are built around the view that businesses are composed of processes that start with customer needs and should end with delighted customers using your product or service.

Adopting a process viewpoint has a profound impact on how an organization operates and how teams view their work. Currently, most companies are organized around functional or “Silo” views: departments and individuals have narrowly defined responsibilities related to specific functions such as accounting, customer service, marketing, etc. Positive change within an organization becomes limited to a defined function and not optimized across an organization. It is not unusual for customer needs to fall between the cracks because no one person owns the process of satisfying the customer. It also is common for many projects to be running at the same time within an organization that sometimes conflict with one another, pull on limited resources, and whose results are not quantifiable in terms of profit and/or customer satisfaction.

In contrast, organizations with process view will assign the Lean Six Sigma resources (Champions, Black Belts, Green Belts, etc.) to map the process across current departmental or functional boundaries. Doing so helps define the interface problems and allows them to propose cross-functional solutions. This process view helps shape decisions and drives project selection based on customer needs, strategic direction, financial requirements and process performance of the company.

Benefits of Lean Six Sigma and ISO9000

The standards, documentation of functional processes, data orientation and passion about quality are all aspects of ISO9000 that fit well with a combined Lean and Six Sigma approach to continuous improvement. Lean Six Sigma would leverage all the standards, documented process, and data already available in your organization. Lean Six Sigma would introduce tools that would help develop process maps with a level of measurable detail that allows identification of non-value-added steps (removal of which will make processes more efficient). It introduces another level of customer focus and a formal methodology (DMAIC) to execute change across functions. It also would engage management and leverage dedicated resources against the projects with the biggest financial impacts to the strategy of the organization. It has been documented that the average Black Belt project saves between $250,000 and $500,000.

These are the additional tools or tactics Lean Six Sigma brings to continuous improvement efforts in an ISO9000 company:

◉ Voice of the Customer as a definition of quality.

◉ Define, Measure, Analyze, Improve, Control (DMAIC) as a structured improvement methodology.

◉ Concept of focus on improving critical process “inputs” rather than just “outputs,” so root causes are attacked and not just symptoms.

◉ CEO and P&L owners are trained and actively engaged in process.

◉ Value-based benefit matrix used to select projects specifically to support strategy and near-term results.

◉ Defined organization and set of roles (Black Belts, Champions, Sponsors) creates accountability for improvement.

◉ Critical mass of resources dedicated to process improvement.

◉ Integration of Lean tools to remove waste and non-value added process complexity/drives speed of delivery (Kaizen events and value stream mapping).

Companies with Both Lean Six Sigma and ISO9000

Many companies who started with ISO9000 have added to it the principals and practices of Lean Six Sigma. The standardization of documentation, mapping of processes, collection of data, auditing of process to assure control and the goal of a quality customer experience are important to both. Together they have many synergies and Lean Six Sigma is a natural step in the evolution of continuous improvement at an ISO 9000 company.

ISO 9000, Lean Six Sigma, Six Sigma Exam Prep, Six Sigma Preparation, Six Sigma Certification, Six Sigma Guides, Six Sigma Career

What is the benefit of having dedicated Lean Six Sigma resources and executive support? It is a basic premise of Lean Six Sigma that executive sponsorship is the key to success. Most companies who have built a Lean Six Sigma infrastructure have subsequently rotated the people they’ve trained into leadership positions. That approach makes a lot of sense. For one thing the people chosen to be Black Belts are typically dedicated individuals chosen from the pool of “best and brightest” – i.e., top performers from each line of business (LOB). During their stints as Black Belts, they are placed in positions working for the LOB executives and see the company from a strategic and a day-to-day operational perspective. So they are people who are using their extensive business knowledge and Lean Six Sigma skills and tools to become leaders and facilitators of change. That is why leadership training is a large aspect of the Black Belt certification process. At companies like GE, it is a requirement to be Six Sigma-certified to be considered for a promotion.

Monday, 8 March 2021

Use Theory of Constraints to Better Focus Lean Six Sigma Efforts

Six Sigma Tutorial and Material, Six Sigma Certification, Six Sigma Exam Prep, Six Sigma Preparation, Six Sigma Guide

From time to time, Belts may meet people who strongly oppose the implementation of Lean Six Sigma. These people may have had bad experiences, such as failed projects or losses on investment, which planted seeds of doubt regarding the usability of the Lean Six Sigma framework. But when projects or deployments fail, is it really Lean Six Sigma itself that is to blame?

A closer look at these negative experiences will lead to the real root cause of failure. Often it is not the Lean Six Sigma methodology at fault, but the false belief in change for the sake of change.

Not all change is good; change is worthwhile only if it brings improvement. To be successful, Belts must understand the difference between making changes that lead to improvements, and simply making changes. To do this, it may help to integrate Lean Six Sigma with the Theory of Constraints to help focus project efforts on the areas that are hampering business.

Change for the Better

What is a good change? The first answer that many Belts think of is a change that is in line with business objectives. But how foolproof is this statement? What if one business objective contradicts another, bettering one but worsening the other?

For example, consider a project aimed at process standardization and control, which is one of the business’ objectives. However, the project also increases process wait time, which is not value added. Is it correct to say, then, that the project failed because it increased non-value-added time? Further, is it worth improving the efficiency of a process step if it is going to increase the wait time before the next step picks up the job? Is it worth increasing the speed of a procedure to generate a file by 9 a.m., even when the file is not needed until noon? Was the cost of implementing the improvement justified?

Clearly, it is not always necessary to implement an opportunity that meets one of the business’ objectives. More thought must go into selecting any opportunity. A project with the goal statement, “Reduce the cost of process ABC by 10 percent by the end of July 2010,” may sound tempting, but Belts also need to think of the implications that this project would involve. In this case, if the end product’s quality suffers, the cost reduction will decrease sales and, in turn, revenue.

Finding a Solution

The problem in the example above is not one of failure or success of Lean Six Sigma. It is not a problem of application of the right tools. It is a problem of focus; Belts must focus their attention on the areas, or constraints, that are causing the real problem.

Project and deployment failures happen not because of the methodology, but because they are implemented in the wrong places. The focus of a deployment should be on achieving global, rather than local, optimization. Belts can increase the efficiency and design of multiple business gears and achieve local optimization, but these efforts do not always help the organization achieve business objectives (such as increasing revenue, cutting cost and increasing throughput). To understand whether a particular improvement brings global optimization, Belts can integrate their current process improvement efforts with the Theory of Constraints (TOC).

Introducing Theory of Constraints

TOC is based on the concept that a chain always has one weakest link. Similarly, in any complex system, at any point in time, there is most often only one aspect of that system that limits its ability to achieve its goal. The same is true for an organization. Thus, for any organization to attain significant improvement, the constraint must be identified and the whole system must be managed to keep that constraint in mind.

The five-step TOC process is:

1. Identify the constraint – Anything that delays or stops a process from achieving its goal.

2. Exploit the constraint – Get the most out of the constraint resource.

3. Subordinate the complete system to the constraint – Let the resources that have excess capacity remain idle, or spend capacity to help the constraint. Avoid unnecessary inventory.

4. Elevate the constraint – Raise the throughput rate of the constraint.

5. Do not let inertia become the constraint – If Belts keep improving the same link of the chain, there will come a time when this link becomes stronger than some other link. To ensure that Belts are always working on the current constraint, the TOC process should be repeated.

An integrated approach to process improvement can be:

1. Define the problem and business objective.

2. Measure the current position. Ask relevant questions and collect the data.

3. Analyze the problems: Use a cause-and-effect diagram to determine undesirable effects. Create a current reality tree, which illustrates the interrelationship of undesirable effects and identify the constraint. Identify assumptions and challenge them.

4. Improve the system performance by: a) exploiting the constraint, b) subordinating the system to the constraint and c) elevating the constraint. Execute Lean and Six Sigma projects as a part of the Improve phase.

5. Control current performance and repeat the process.

At Step 4, Belts use the Lean Six Sigma methodology. Other steps integrate TOC with Lean Six Sigma to ensure that the correct focus is on business objectives.

Example: Work Distribution and Resource Management


Six Sigma Tutorial and Material, Six Sigma Certification, Six Sigma Exam Prep, Six Sigma Preparation, Six Sigma Guide
The following case study shows how TOC can be integrated with Lean Six Sigma. The objective of the project is maximum output with zero defects. The project has four associates: three programmers and one tester. The tester can test two modules per day, and each programmer produces one module per day. The tester is available for half a day, while the programmers are available full time. The workload distribution is even, and each resource works on its own task.

Step 1 – Define the problem and business objective

Problem: Low productivity of the team, low bottom-line and top-line performance
Business objective: 100 percent productivity and higher profit and revenue

Step 2 – Measure current position

Work is piling up for the tester:

Output = 1 module/day = 1.5 person-days of work/day
Input = 3.5 person-days of work/day
Productivity = 42.85 percent
WIP inventory growth = 2 person-days of work/day

Step 3 – Analyze the problems – Identify the constraints

It is easy to see that the constraint is the tester. The inventory problem and restricted throughput stem from low tester effort/efficiency.

Step 4 – Improve

a. Exploit the constraint: The project leader works on increasing the availability of the tester. After working with other teams, the project leader succeeds in getting this tester full time. The team productivity is now:

Output = 2 modules/day = 3 person-days of work
Input = 4 person-days of work
Productivity = 75 percent
WIP inventory growth = 1 person-day of work/day

b. Subordinate to the constraint: The Project leader reduces the number of programmers to two, and utilizes the programmer somewhere else. Now:

Output = 2 modules/day = 3 person-days of work
Input = 3 person-days of work
Productivity = 100 percent
WIP inventory growth = 0 person-days of work/day

c. Elevate the constraint: The project leader purchases a testing tool, so that the tester can now test three modules per day. Because of this, the team productivity is now:

Output = 3 modules per day = 4 person-days of work
Input = 4 person-days of work
Productivity = 100 percent
WIP inventory growth = 0 person-days of work/day

By raising the throughput rate, the organization elevated top-line as well as bottom-line performance.

Step 5 – Control current performance and repeat the process

After improving the performance of the tester, the leader did not give up. There is always another bottleneck; the constraint can shift to the other resources. So, the project leader started again from the beginning and kept observing the process for new constraints. The constraint can shift to marketing and sales or even lie upstream with the policies of the company.

Thus, any organization can adopt this generalized yet powerful framework to improve its performance continually and reap the benefits of Lean Six Sigma and TOC.

Saturday, 6 March 2021

What To Do When The Low-Hanging Fruit Is Gone

This post provides an example of how an operational department (like a cardiac catheterization lab) can be transformed from a low sigma level to a higher sigma level, and what that would mean to the overall organization. Patient satisfaction, physician satisfaction, reduced overtime, reduced patient wait times, increased revenues and an enhanced quality of life for staff are some of the outcomes of moving to the higher sigma level. The goal is to move from the current state to a future, more productive state. Integrating the Six Sigma culture into entire organizations can multiply the positive effects and make a significant impact at all levels.

Also Read: Certified Manager of Quality/Organizational Excellence (CMQ/OE)

The cost of providing high quality services within the healthcare organization has increased significantly over the past one or two decades, primarily due to decreased payments and the increased cost of doing business.

This has led many organizations to seek outside help in order to find and develop additional methods of reducing costs and increasing revenues. In addition, customer satisfaction has remained, appropriately so, as a non-negotiable component of providing care. This article will describe in very general terms one extremely successful method utilized to achieve reduction of cost, increased revenues and heightened customer satisfaction while maintaining high levels of quality.

Healthcare Organizations and Consultants

Over the past decade, the need and desire for healthcare institutions to operate more efficiently has been driven largely by financial concerns. With decreasing reimbursements and the rising cost of labor and supplies, healthcare organizations have been driven to look within to find savings. Generally, the accepted rule has been that there are two primary areas to find savings, either through reductions in labor costs or by reducing the high cost of supplies. With the continuing shortage of qualified healthcare professionals, registered nurses, registered radiologic technologists, etc., the opportunities to reduce expenses by reducing labor costs are neither advisable nor generally accepted as the answer to cost reduction initiatives. Morale and productivity potentially fall victim to this tactic. Additionally, pursuing all revenue growth opportunities can serve to offset many of the factors associated with increased costs. As one CEO said, “revenue growth cures many sins associated with cost.”

Revenue growth aside, cost reduction measures associated with inventories are seemingly the only opportunity left to find much-needed dollars. Liquidity of monies associated with inventory has improved over the last decade; however, so has the increased cost of those supplies. A perfect example of this may be found in the cost of stents for coronary and peripheral use and now drug-eluting stents. As better management of inventories has occurred, the associated savings have been negated by the increased cost of technologies, i.e., stents. This may make it seem like a catch-22 for a healthcare organization. However, with good management, improved physician cooperation in the purchasing process and enhanced relationships with the suppliers, many institutions have kept slightly ahead of the curve in cost containment.

Six Sigma Tutorial and Material, Six Sigma Exam Prep, Six Sigma Preparation, Six Sigma Exam Prep, Six Sigma Guides
Figure 1: Low-hanging Fruit

These measures have harvested what many refer to as “the low-hanging fruit” of cost containment (see Figure 1). Seasoned managers and administrators, through experience, logic and intuition, have harvested the low-hanging fruit of cost efficiency and productivity. The demand for more efficient use of capital dollars as well as labor has driven many organizations to ask whether they can continue to provide these potentially life-saving procedures. This obviously has a negative impact on public perception of the healthcare organization. How do we continue to provide these services, remain competitive and at the same time not lose dollars on the service in question? The answer may lie in Six Sigma.

Six Sigma


First, what Six Sigma is not. It is not a secret society, a slogan or a cliché. Six Sigma is a highly disciplined process that helps an organization focus on developing and delivering near-perfect products and services. Why “Sigma” (s)? It’s a statistical term that measures how far a given process deviates from perfection. The central idea behind Six Sigma is that if you can measure how many “defects” you have in a process, you can systematically figure out how to eliminate them and get as close to “zero defects” as possible. More about that later.

For many years, healthcare consultants have been perceived as a four-letter word, yet a necessary evil in the operations of the modern healthcare organizations. Up until the middle of the 1990s, many healthcare-consulting firms relied on recruiting the “best of the best” with healthcare backgrounds. Their process for providing recommendations regarding improvement came from personal experiences and some limited benchmark data. However talented these consultants, to a great degree even today, they still rely on personal experience to make recommendations and drive change. Although there is much to be said for personal experience, it is still relatively subjective in nature. This is where Six Sigma began to make an impact on healthcare organizations. To achieve Six Sigma quality, a process must produce no more than 3.4 defects per million opportunities. An “opportunity” is defined as a chance for nonconformance, or not meeting the required specifications. This means we need to be nearly flawless in executing our key processes.

Key Concepts of Six Sigma


At its core, Six Sigma revolves around a few key concepts.

1. Critical to Quality: Attributes most important to the customer

2. Defect: Failing to deliver what the customer wants

3. Process Capability: What your process can deliver

4. Variation: What the customer sees and feels

5. Stable Operations: Ensuring consistent, predictable processes to improve what the customer sees and feels

6. Design for Six Sigma: Designing to meet customer needs and process capability

Organizations Feel the Variance, Not the Mean


Often, our inside-out view of healthcare is based on average or mean-based measures of our recent past. Healthcare organizations and patients don’t feel averages; they feel the variance in each transaction or procedure. Six Sigma focuses first on reducing the variation in a process and then on improving the process capability. Organizations value consistent, predictable business processes that deliver world-class levels of quality. This is what Six Sigma strives to produce.

Six Sigma was born to answer the question of how to improve efficiencies in manufacturing processes. General Electric, under the leadership of Jack Welch and others, implemented this process across all GE businesses, achieving impressive results in cost and quality improvement. Over a short period of time, the Six Sigma methodology has also migrated to the healthcare environment. In the current climate at GE, Six Sigma is no longer simply a process, but has become ingrained as part of the company culture. For a short primer on Six Sigma, refer to Figure 2.

Six Sigma Tutorial and Material, Six Sigma Exam Prep, Six Sigma Preparation, Six Sigma Exam Prep, Six Sigma Guides
Figure 2: Comparison of Sigma to DPMO

The sigma level is captured in the left column and the defects per million opportunities, or DPMO, in the right. Here is a simple illustration of this concept. Let’s assume your company is manufacturing styrofoam cups. Each cup costs $1.00 to produce, which is inclusive of all costs, including equipment, supplies, and labor. At the 2 sigma (2s) level, your firm would discard 308,537 of the one million cups manufactured due to defects. The higher the sigma level, the better the performance. If your company were moved to the 6s level, you would only discard 3.4 defective cups per million. It is easy to see what that would mean to your profit margin.

Let’s move this scenario into the healthcare environment. It is relatively easy to see what transforming an operational department (like a cardiac catheterization lab) operating at a low sigma level up to a higher sigma level would mean to the overall organization. Patient satisfaction, physician satisfaction, reduced overtime, reduced patient wait times, increased revenues and an enhanced quality of life for staff are some of the outcomes of moving to the higher sigma level. The goal is to move from the current state to a future, more productive state. Integrating the Six Sigma culture into entire organizations can multiply the positive effects and make a significant impact at all levels.

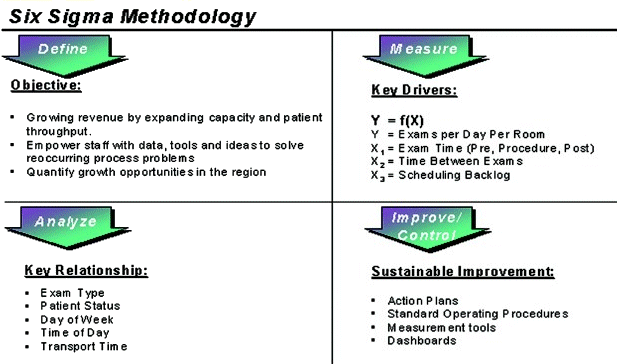
The primary methodology of Six Sigma functions in what is referred to as the DMAIC (pronounced da-may-ick) (Define, Measure, Analyze, Improve, Control) process. Figure 3 identifies this process and the functions that occur in each phase.

Six Sigma Tutorial and Material, Six Sigma Exam Prep, Six Sigma Preparation, Six Sigma Exam Prep, Six Sigma Guides
Figure 3: Six Sigma Methodology Overview

DMAIC, or Define, Measure, Analyze, Improve & Control are the five phases that must be rigorously and systematically scrutinized in order to provide answers to the big “Y” question. Determining what the customer CTQ (critical to quality) issues are is accomplished in the Define stage. That is referred to as the “big Y.” The big “Y” in our example is patient throughput.

In Measure, the “x’s” are identified. “X’s” in our example are identified as exams per room per day, procedure times, time between patients, etc.

In the Analyze, we identify the key relationships to throughput. In the Improve phase, action plans and standard operating procedures (SOPs) are identified.

In the Control phase, the implemented changes based upon the Six Sigma methodology are continued and monitored. This is a significant phase of the DMAIC process, as the sustainability of the changes from the current state to the future improved state is important to the long-term success of the project and thus the financial health of the organization. Merely changing is not enough. Changes, no matter how significant, tend to drift back to the prior state after time. With Six Sigma and utilizing DMAIC, the change is moved from that current state to the improved future state along with mechanisms to sustain those changes.

To better understand this process at a very simple level, the below example demonstrates how using the Six Sigma methodology in healthcare would move certain metrics to enhance the productivity and efficiency of a cardiac catheterization lab.

Our example department has a single cath suite that operates routinely on a twelve- (12) hour day with a single shift of staff. Physicians often cite their top concern as getting patients into the lab. That makes throughput the big “Y.” One of the important areas of this process is gaining the insights of the customers, in this case, the physicians. This is called the voice of the customer, or VOC. In our scenario, the VOC indicates the physicians are very happy with the dedication and experience of the staff. Their primary concern is access. So the big “Y,” or throughput, is the product the team focuses on. Increased throughput equals enhanced access.

After data gathering on the operations of the department, a significant volume of data is provided to the organization as well as the physicians who practice in the catheterization lab. In Figure 4, the data depicts the cycle time of procedures in the cath lab, defined as the time the patient enters the lab to the time they exit the lab, plus the time between patients.

Six Sigma Tutorial and Material, Six Sigma Exam Prep, Six Sigma Preparation, Six Sigma Exam Prep, Six Sigma Guides
Figure 4: Patient Cycle Time – Current State

The cycle time is divided into essentially four segments:

1. Pre-procedure time
2. Procedure time
3. Post-procedure time, which equals…
4. Total room time and time between patients.

By scrutinizing the times as well as the standard deviations, the team will begin determining where improvement might be achieved. Let’s briefly review what generally occurs in each phase.

In the first segment, pre-procedure time, the patient is brought into the cath suite, and moved from the cart to the cath table. ECG, blood pressure, and Sp02 monitors are all applied. Sterile drapes are applied and the appropriate equipment for the procedure is prepared. In this example, at some point the physician performing the procedure is notified. When he or she arrives, they will generally review the patient’s chart for pertinent information, labs, etc. and speak to the patient. They will then scrub and gown for the procedure.

When the physician begins the procedure, the pre-procedure clock stops and the procedure clock begins. Now we are in the procedure phase. The procedure is performed per protocol. When the procedure ends, the post procedure time begins.

The post procedure phase is usually when the patient is discontinued from monitoring, drapes are removed, etc. Depending on the findings of the cath procedure, family members may, on occasion, be brought into the suite to discuss these findings with the physician. The patient is then removed from the suite and the post procedure clock stops.

In the example above, these three times are 21.3, 30.6, and 14.6 minutes, respectively. The total case time or cycle is the sum of the segments: 66.5 minutes.

The fourth segment is the time between patients or the time the patient leaves the room until the time the next patient enters the room. Utilizing the Six Sigma methodology, the team will break down each segment to look for opportunities for time savings. There are many opportunities or “x’s” in each segment that may provide time savings. These savings per procedure multiplied by the number of procedures accomplished per day will undoubtedly provide enhanced throughput.

It is important to remember that the data provided is an aggregate of all the procedures performed in the lab, so averages are used. Departments not performing interventions or pacemakers might see their procedure times lower on average then other facilities performing those procedures.

It is possible, using the Six Sigma methodology, to identify areas of opportunity by comparing how an institution varies from a benchmark value. It may be that routine diagnostic procedures are, on average, meeting benchmark numbers whereas the interventions are far exceeding those benchmarks. This type of information might provide the team their first evidence on where change can be initiated. Utilizing the DMAIC format, the organized scrutiny of each equation segment can lead to several action plans that will help the team find additional time per procedure.

In operations that have a backlog of scheduled non-emergent patients, the opportunity exists to reduce backlog and increase patient and physician satisfaction. Additionally, the potential reduction in overtime will enhance the quality of life issues for staff, providing more time away from a high stress environment. From an administrative perspective, implementing Six Sigma-derived plans can lead to increased revenues through added capacity and reduced costs through the reduction of overtime.

In Figure 5, we see the impact the Six Sigma methodology has had on throughput in our example department. Pre-procedure time went from 21.3 minutes with a standard deviation of 17.4, to the improved state of 16.7 minutes with a standard deviation of 6.9. Simply put, throughput is increased, thus increasing capacity. If the example scenario were to yield capacity for two additional patients per day at the average reimbursement, one can see how revenue would be enhanced, as well as customer satisfaction.

Six Sigma Tutorial and Material, Six Sigma Exam Prep, Six Sigma Preparation, Six Sigma Exam Prep, Six Sigma Guides
Figure 5: Patient Cycle Time – Post Measurement Future State

One other significant area relating to enhanced catheterization lab operational efficiency that the process of Six Sigma focuses on is the role the cardiologist and how his/her practice patterns impact operations. This is a very complex issue in the department. Due to that complexity and the potential sensitivity of this issue, we will discuss that portion in greater detail in a future article. However, there is significant evidence that the Six Sigma process lends itself very well to identifying methods that improve this process as well.

Friday, 5 March 2021

How should leaders inspire their employees?

Prince2 Tutorial and Material, Prince2 Certification, Prince2 Learning, Prince2 Exam Prep, Prince2 Preparation

In order to get the best from your employees, the single greatest thing you can do is inspire them. Inspired employees are better motivated, better engaged, and more committed in their roles. They are more proactive, productive and achieve better outcomes as a result. But how do leaders go about inspiring their employees? Here we take a look.

Spending time with your employees

A recent study by Leadership IQ looked at how much time leaders should spend with employees in order to increase their engagement, inspiration and innovation. The study of more than 30,000 people revealed that, unsurprisingly, the more time leaders spend with employees the better the outcomes were.

Interestingly, the curve of the graph flattens off around six hours, leading the study to conclude that six hours is an optimal amount of time for leaders to be spending directly interacting with employees. However, with such large spans of control in many businesses, one-on-one time with each team member is an impossible task, but all is not lost. Up to the six-hour pinnacle, the study showed a linear increase of positive impact to time spent – every minute you give your employees generates benefits.

(It's worth noting that this time spent does not have to be in-person, it could be over the phone, video call, etc. What is important though is that it is one-on-one interaction.)

In his video of the study’s outcomes, Mark Murphy goes on to highlight the importance of prioritising who gets that time. Think of your staff as you would your customers. Just as you would focus your attention on your best customers, you should give more time to your high performers – they should be your priority.

Prince2 Tutorial and Material, Prince2 Certification, Prince2 Learning, Prince2 Exam Prep, Prince2 Preparation

This is something Forbes has also picked up on. This article discusses how managers often spend 80% of their time with 20% of their workers. That’s not to say that you should ignore or disregard your lower performing team members, just that you should become aware of whether you are spending a disproportionate amount of time on average employees. Time that could have a huge influence if spent directly interacting with others.

More ways to motivate...

It is evident that spending time with employees has a profound impact, but what more can you do to inspire them? Here are 5 ways you can be a leader who motivates. Combine these with that one-on-one time and you’ll have a recipe for success!

1. Tailor your approach

When spending the quality time directly interacting with a member of your team, it is important that you know the people you are shooting to inspire, and tailor your approach accordingly. Employees require a leader who genuinely cares and pays attention. And leaders must understand the tendencies and behaviours of their employees in order to get the best from them.

2. Craft an open environment

Employees respond in a hugely positive way to a leader who is open and honest. Crafting a trusting environment in the workplace begins at the top. So, whether it’s discussing the challenges the business is facing, or sharing the truth about what went wrong with a client, it is important that you build an open culture. Not only will your teams gain respect for you, but they may end up being part of a solution.

3. Develop your team

Teaching and guiding your team means more than just delivering the odd inspirational lecture. In order to support employees in a meaningful way it is essential that you not only teach them, but facilitate their learning too. Leaders can inspire employees by providing them with the tools to perform better in their roles. This could be in the form of new software investment and training, or a professional development qualification.

4. Reward employees

There’s no doubt about it, incentives inspire performance. But often it is not just the monetary value of the reward, but the recognition associated with it that is important. Being a leader who acknowledges an employee’s achievement will inspire the performance of your entire team.

5. Pave the path to success

It’s almost too obvious to say, but a top way to inspire your employees is leading by example! Demonstrate values and create positive change. Have goals and invest in personal development. Communicate with your team in a way which resonates, be approachable and work collaboratively too. Show your team that you are authentic, by being authentic! Pave the path to success by being a leader worth following.

Source: prince2.com

Wednesday, 3 March 2021

Overcoming Capacity Constraints with Optimization Modeling

Six Sigma Tutorial and Material, Six Sigma Exam Prep, Six Sigma Preparation, Six Sigma Guides, Six Sigma Career

“Speed is survival.” That could be called the mantra for all manufacturing and service organizations in today’s uncertain and continuously changing global economy. In this example, a leading manufacturer of color picture tubes (CPTs) was posed with a survival challenge: to improve manufacturing productivity. By adopting Lean Six Sigma methods, the manufacturer was able to increase speed and, thus, improve productivity and throughput capacity.

As depicted in Figure 1, this case study illustrates the application of operations research techniques (optimization modeling) in a Lean Six Sigma DMADV project to identify, validate and roll-out optimum, robust and innovative solution which helped the CPT organization to improve throughput capacity and productivity.

Six Sigma Tutorial and Material, Six Sigma Exam Prep, Six Sigma Preparation, Six Sigma Guides, Six Sigma Career
Figure 1: LSS with Optimization Modeling

In this operation, part of the CPT manufacturing process involves a process know as frit sealing. The process attaches the glass faceplate to the glass funnel section of the tube with a mixture of raw glass material called “frit,” which is heated in a multistage gas-fired furnace to make a hermetic seal. Figure 2 shows the setup of the manufacturer’s frit-sealing furnace, which is 30 meters long.

Six Sigma Tutorial and Material, Six Sigma Exam Prep, Six Sigma Preparation, Six Sigma Guides, Six Sigma Career
Figure 2: Frit Sealing

Figure 3 shows the original top and front view of the CPTs as they are loaded on a frit-sealing holding apparatus, know as a “jig,” as they enter the furnace.

Six Sigma Tutorial and Material, Six Sigma Exam Prep, Six Sigma Preparation, Six Sigma Guides, Six Sigma Career
Figure 3: Top and Front Views of CPTs

Each zone of the furnace is temperature-controlled as required by a frit-sealing temperature profile. Four CPTs in a row are loaded on frit sealing jigs and pass inside the furnace on a conveyor belt. The glass panels of the CPTs are placed over a frit-paste-coated glass funnel. The frit then melts inside heating zones of the furnace (Figure 4) and crystallizes to seal together the edges of the glass panel and funnel. Frit-sealed CPTs are then unloaded from the furnace and moved forward for further processing.

Six Sigma Tutorial and Material, Six Sigma Exam Prep, Six Sigma Preparation, Six Sigma Guides, Six Sigma Career
Figure 4: Furnace Heating Zones

Define?


Due to falling CPT market prices and its profitability, management at the CPT manufacturer deduced that, if the production throughput capacity of the CPT facility was not increased by at least 50 percent, it would not be viable to continue operation. Hence, management initiated a program for enhancing CPT throughput capacity with a target to increase mass production capacity by 50 percent to reduce the operational cost of making CPTs.

As part of the capacity expansion program, the goal of the Lean Six Sigma project was to increase the throughput capacity of the process from 1.2 million CPTs per year to 1.8 million per year. The scope of the project was limited to the frit-sealing process and its associated production units.

Measure


The critical-to-quality measure for this project is takt time or line index (denoted by “i”). Takt time is the time gap between productions of each CPT.

Throughput capacity (C) can be calculated as:

C = Duration in a year * % Utilization * % Process Yield
Takt Time (i)

At a production capacity of 1.2 million CPTs per year, the manufacturer had a process yield of 85 percent and production system utilization of 93.75 percent. The frit sealing furnace was operated at a takt time/index of 20.8 seconds. The target of the project was to reduce takt time to the specification limit of ? 14 seconds and, thereby, increase the velocity of the manufacturing line without altering process yield and line utilization.

Takt time (i) can be mathematically derived as follows:

1) Length of furnace (L) = frit sealing processing time (Tp) x velocity (V)
2) Pitch of jig (p) = Time to cover one pitch (t) x V
3) t = number of CPTs in a row inside frit-sealing furnace (N) x Takt time (i)

From the above equations:

i = Tp x p
N x L

Optimization Model


Using operations research integer programming techniques, the following is the optimization model to optimize the frit-sealing capacity expansion problem:

Subject to constraints:

◉ L = 30 m – There is no space available to increase the furnace length for further capacity expansion.
◉ Tp ? 104 min. – There is no process margin left to cut down processing time below 104 minutes for capacity expansion.
◉ P ? 0.4 m – There is no gap between the 21-inch CPTs for pitch of less than 0.4 meters along the width of the CPTs, as per initial jig design.
◉ 1 < N ? 4 – There is no gap between the 21-inch CPTs along the length of the CPT.
◉ i ? 14 sec. – As per the project’s objective, takt time should be less than 14 seconds.

Decision variables:

◉ The number of CPTs in a row inside the frit-sealing furnace (N) – integer variable. Initially, N= 4.
◉ Pitch of jig (p). Initially, p = 0.4 meters.

Analyze


Based on the constraints on the optimization model, there is no scope of any reduction of takt time as the values of the each of the parameters (L, Tp, p, N) are at their extreme limits.

In such a scenario, an innovative idea was generated to break the constraints for capacity expansion. Due to conical shape of the CPT funnel, the pitch, width and length of the frit-sealing jigs can be reduced by overlapping CPTs with adjacent CPTs on the front, rear and same rows of CPTs.

So, there are two options:

1) Pitch can be reduced by 0.065 m. As a result, the revised constraint is p ? 0.335 meters; OR
2) The number of jigs in a row can be increased to six. As a result, the revised constraint is 1 < N ? 6.

However, the above two ideas cannot co-exist together, meaning that if the number of CPTs in a row are increased, then pitch cannot be reduced and vice-versa.

Hence,

p ? 0.335 m, if and only if N = 4
OR
1 < N ? 6, if and only if p = 0.4

Solution


Based on the revised constraints, Table 1 provides the solution space which meets the 14-second takt time requirement.

Table 1: Solution Analysis

No. of jigs/CPTs in a single row (n) Pitch (p) (meters)  Length of furnace (meters) – constant  Frit-sealing processing time (min.) – constant Takt time (project Y) in seconds Remarks  Select Option
4 0.4 30 104 20.80 Initial state No
4  0.335  30  104  17.42  More than 14 sec. takt time   No 
5  0.4  30  104  16.64  More than 14 sec. takt time   No 
5  0.335  30  104  13.94  N and p cannot be changed simultaneously   No 
6  0.4  30  104  13.87  Viable solution, as it satisfies all constraints   Yes 
6  0.335  30  104  11.61  N and p cannot be changed simultaneously   No 

The only solution which meets the 14-second takt time requirement is N= 6 and p= 0.4 meter, as seen in Figure 5.

Six Sigma Tutorial and Material, Six Sigma Exam Prep, Six Sigma Preparation, Six Sigma Guides, Six Sigma Career
Figure 5: Solution Analysis

Design


The diagram in Figure 6 depicts the change with N = 6 and p = 0.4 meters. In this figure, six CPTs are loaded onto frit-sealing jigs. Taller and smaller jigs are altered to provide the overlap in a given row. There is no overlap between CPTs in the front rows of CPTs.

Six Sigma Tutorial and Material, Six Sigma Exam Prep, Six Sigma Preparation, Six Sigma Guides, Six Sigma Career
Figure 6: Top View and Front View of CPT Loaded on Frit-sealing Jigs

Prototypes of the smaller and taller jigs were created and tested. Based on the solution concept, frit-sealing jigs were redesigned with computer-aided designing (AutoCAD) tools.

The following are the key changes made to the frit-sealing jigs:

◉ A reduction of the length of the jig by 0.0825 meters.

◉ An overlapping of the CPTs, which was achieved by lowering the height of one frit-sealing jig and increasing the height of an adjacent jig.

◉ Redesigning the spacers and chains on the loaders and unloaders (jig cushions) to load and unload six CPTs from furnace. As a mistake-proofing measure, adding proximity sensors before CPT loading to ensure the correct sequence of jigs.

Verify


Prototypes of the frit-sealing jigs were created and successfully tested on the running furnace to test all the quality parameters of the frit-sealing process.

The benefits from the innovative design of the frit-sealing jigs included:

◉ Furnace extension cost savings totaling $1 million to meet frit-sealing capacity expansion requirements.

◉ Saved cost of production downtime of 10 working days by saving a production of frit-sealing worth 33,000 CPTs. Frit-sealing capacity expansion requirement of 1.8 million CPTs per year, as part of the larger capacity expansion program.

Through the use of optimization modeling aids, all capacity constraints at the CPT manufacturer were conquered. The solution improvements helped the facility meet its desired throughput capacity.

Monday, 1 March 2021

Top 20 Prince2 Interview Questions For 2021

Prince2 Interview Questions 2021, Prince2 Interview Questions, Prince2 Exam Prep, Prince2 Preparation, Prince2 Guides, Prince2 Certification, Prince2 Learning, Prince2 Career

Making your way towards the Project Management field is not easy. You need to have specific skills, you need to have knowledge about essential tools, you need to acquire specific soft skills to carry out the entire process. And we don’t need to mention it, having a skill like Prince2 in your resume is always a cherry on the top!

But, as the project management field is ever-evolving, the gateway to enter this field too is being more and more guarded by passing days. This means you are more likely to face new challenges at the interview table once you appear for one.

As you know, with the proper tactics and particular practices it is easy to cross any hurdle, and so is the project management interviews. Since interviewers nowadays take a keen interest in Prince2 methodologies in order to craft the interview questions, we fetched out the top 20 Prince2 interview questions just for you. Have a look!

Top 20 questions to crack the PRINCE2 Interview

1. What is Prince2?

Ans. PRINCE2 (PRojects IN Controlled Environments) is a structured project management method and practitioner certification program. PRINCE2 emphasizes dividing projects into manageable and controllable stages.

2. Give a proper definition of a project.

Ans. Any undertaking carried out individually or collaboratively and possibly involving research or design, that is carefully planned (usually by a project team) to achieve a particular aim is called a project.

3. What are the key features of prince 2?

Ans. The key features of Prince2 are:

◉ It is well organized

◉ You can apply it to any project

◉ It is based on management by exception

◉ It has some extraordinary diagnostic tools to offer

◉ It is consistent and reusable.

4. What are the 7 processes of Prince2?

Ans. The 7 processes of Prince2 are as follows:

Prince2 Interview Questions 2021, Prince2 Interview Questions, Prince2 Exam Prep, Prince2 Preparation, Prince2 Guides, Prince2 Certification, Prince2 Learning, Prince2 Career

◉ Starting Up A Project, in which the project team is appointed including an executive and a project manager, and a project brief is produced

◉ Initiating A Project, in which the business case refined and Project Initiation Documentation assembled

◉ Directing A Project, which dictates the ways in which the Project Board oversees the project

◉ Controlling A Stage, which dictates how each individual stage should be controlled, including the way in which work packages are authorized and distributed

◉ Managing Product Delivery, which has the purpose of controlling the link between the Project Manager and the Team Manager(s) by placing formal requirements on accepting, executing and delivering project work.

◉ Managing Stage Boundaries, which dictates how to transition from one stage to the next

◉ Closing A Project, which covers the formal decommissioning of the project, follow-on actions, and evaluation of the benefits.

5. What are the 7 themes of Prince2?

Ans. The 7 themes of Prince2 are:

◉ Business Case

◉ Organization

◉ Quality

◉ Plans

◉ Risk

◉ Change

◉ Progress

6. What will be the essential steps if you want to direct a project?

Ans: Directing a project involves the following steps:

◉ Supporting a project

◉ Accepting the results 

◉ Providing approval from the management

7. Define ‘Plan’ in PRINCE2® methodology.

Ans. A plan is basically a timeline that provides us with a vision of how the objectives can be achieved and point out the main products, activities, and resources that are required for the scope of the plan.

8. What are the 7 principles of Prince2?

Ans. The 7 principles of Prince2 are:

◉ Continued Business Justification: The business case is the most important document, and is updated at every stage of the project to ensure that the project is still viable. Early termination can occur if this ceases to be the case.

◉ Learn From Experience: Each project maintains a lesson log and projects should continually refer to their own and to previous and concurrent projects' lesson logs to avoid reinventing wheels. Unless lessons provoke change, they are only lessons identified (not learned).

◉ Defined Roles and Responsibilities: Roles are separated from individuals, who may take on multiple roles or share a role. Roles in PRINCE2 are structured in four levels (corporate or program management, project board, project manager level, and team level). Project Management Team contains the last three, where all primary stakeholders (business, user, supplier) need to be presented.

◉ Manage by Stages: the project is planned and controlled on a stage by stage basis. Moving between stages includes updating the business case, risks, overall plan, and detailed next-stage plan in the light of new evidence.

◉ Manage by Exception: A PRINCE2 project has defined tolerances (6 aspects above) for each project objective, to establish limits of delegated authority. If a management level forecasts that these tolerances are exceeded (e.g. time of a management stage will be longer than the estimated time in the current management stage). it is escalated to the next management level for a decision about how to proceed.

◉ Focus on Products: A PRINCE2 project focuses on the definition and delivery of the products, in particular their quality requirements.

◉ Tailor to Suit Project Environment: PRINCE2 is tailored to suit the project environment, size, complexity, importance, time capability, and risk. Tailoring is the first activity in the process of Initiating A Project and reviewed for each stage.

9. What are the steps that are involved in planning?

Ans. Steps involved in the planning are:

◉ Directing a project(DP)

◉ Starting up a project(SU)

◉ Initiating a Project(IP)

◉ Controlling a Stage(CS)

◉ Managing a project delivery(MP)

◉ Managing a Stage Boundary(SB)

◉ Closing a Project(CP)

10. What is the risk register?

Ans. A risk register is a table that contains the list of risks that can threaten the goals of the project.

11. Who are the primary stakeholders of a Prince2 project?

Ans. There are 3 primary stakeholders of a Prince2 project:

◉ Users 

◉ Suppliers

◉ Business sponsors

12. What are the different levels of plans?

Ans. The different levels of plans are as follows:

◉ Project Plan

◉ Stage Plan

◉ Team Plan

◉ Exception Plan

13. Which role is responsible for producing a Product Status Account?

Ans. Project Support responsible for producing a Product Status Account

14. Which role is responsible for drafting the outline Business Case?

Ans. The executive is responsible for drafting the outline Business Case.

15. Which role assures the stage and project progress against agreed tolerances?

Ans. Project Assurance confirms stage and project progress against agreed tolerances.

16. What are the two types of progress controls provided by PRINCE2?

Ans. Prince2 provides time-driven and event-driven progress control.

17. Which process can be carried out without following the Closing a Project(CP)?

Ans. Managing the Product Delivery process can be carried out easily without following the PRINCE2® methodology.

18. State the objectives of closing a project process by following Prince2 methodology.

Ans. Objectives of closing a project process with the help of Prince2 methodology are:

◉ Verifying the user’s approval of the project deliverables

◉ Ensuring the products support after the product delivery and project closure

◉ Reviewing the project performance of the project by comparing the actual project with the baselined documents

◉ Assessing the benefits already acquired and then planning the review of benefits which will be acquired once the project is finished

◉ Addressing the open issues and risks in the project and then performing a follow-up action based on the recommendations.

19. Name a process that triggers the request to deliver a project.

Ans. Initiating a Project process triggers the request to deliver a project.

20. Which document contains the planned and actual dates for product approval and hand-over?

Ans. Product Checklist document contains the planned and actual dates for product approval and hand-over.

Friday, 26 February 2021

DOE in Software Testing: The Potential and the Risks

Testing software is hard work. Many aspects of software systems are difficult or impossible to observe and measure directly. That makes finding defects, characterizing performance and estimating reliability the toughest parts of the development process.

While there are no silver bullets (and no “lead bullets” either, as per Dr. Barry Boehm, noted software engineering professor and author), there are some tools and approaches in the Six Sigma toolkit that are worth understanding in connection with software testing.

A number of articles have pointed out benefits connected with the application of design of experiments (DOE) – and fractional factorial designs in particular – to software testing. While statistical approaches like this do hold promise, those who use them need to understand them in a balanced way – looking for where they do and do not fit. Test designers also should understand some of risks involved.

Strengths of DOE in Test Planning


DOE provides, at the very least, a way to think about the whole range of test conditions that could be considered. DOE helps a test designer to think in terms of “factors” and “levels” that describe prospective test conditions (Table 1). That alone can help identify the test landscape and scope the magnitude of a particular test challenge.

Table 1: Factors and Levels
Test Situation Factors  Levels 
External States Printer Status Ready, Busy, Off
Data Entry  Data Field 1  Empty, Wrong Type, Wrong Value 
Internal States  Memory  Available, Unavailable, Corrupt 
I/O  File System  NTFS, FAT32, Custom 

Part of the “design” in a DOE is to assemble factor combinations into and efficient set of cases that make the best use of limited amounts of data. That fits with the test challenge to learn as much as possible, in limited time, without the luxury of exhaustive coverage of all possible data.

Full Factorial DOE Designs


A full factorial design looks at all possible combinations of the factors at all their levels. While the benefits of DOE are more pronounced with more factors and levels, a simple three-factor case is a good way to illustrate some key points. A full factorial design for three factors, like “workload,” “number of servers” (roundtrip in a transaction) and “security overhead” – each at two levels, would call for eight cases.

Six Sigma Tutorial and Material, Six Sigma Learning, Six Sigma Certification, Six Sigma Preparation, Six Sigma Exam Prep, Six Sigma Career
Figure 1: Full Factorial Design Three Factors and Two Levels

The eight test cases depicted in Figure 1 allow for the isolation of the impacts of each factor on the test results (response time), and for the quantification of interactions (beyond the scope of this article). In a full factorial, a test designer gets all the information, but must pay for it. Three factors at two levels are easy enough to study exhaustively, but more factors and levels require more resources. Six factors, for example, at just two test levels each, call for 64 cases in a full factorial. The information paid for in running such a large test set would include the isolation of the effects of complex interactions (3-,4-,5- and 6-way) that are very rarely important. Experimenters, like testers, strive to focus resources on the information most likely to be valuable, and they see the inefficiency in large factorial designs. Interest in spending less time and effort to uncover the specific behaviors of interest usually favors fractional factorial designs in test settings.

Fractional Factorial Designs


As the name indicates, a fractional factorial looks at a subset of all possible combinations. Not just any subset though. There is a smart way to skip and keep test cases so that the smaller plan has a good chance of learning most of what the larger plan would have. A look at the logic and then a walk through of the uses and risks would valuable.

Looking at Figure 1, a good question is: “If you only had time to run four tests (not eight), which four would you run?” A little thinking will probably result in what DOE suggests – a plan like the one shown in Figure 2.

Six Sigma Tutorial and Material, Six Sigma Learning, Six Sigma Certification, Six Sigma Preparation, Six Sigma Exam Prep, Six Sigma Career
Figure 2: Fractional Factorial Design

The four test cases depicted in Figure 2, do a pretty good job covering the domain of the complete set of tests. Thinking in the geometry of the illustration, each face of the three-factor cube is covered with two 2 test cases. The test result for each missing case can be estimated using the combined information from the included cases. The logic in such a design is – if the behavior of the system under test is fairly “continuous” – what gets learned in the four test cases that are run can be used to interpolate what would be expected at the cases that were not run.

What does it mean to be continuous? Factors like workload and number of servers probably each influence the overall response time in a smooth, additive way. More or less workload and/or more servers likely push the response time up or down in a reasonably behaved way. There are not big spikes up or down at unknown points. In contrast, if the factors were application and file type (graphics, text), there could well be a certain combination that is quite unlike any others. Trying to study the part in order to know more about the whole could be futile. Unfortunately this cannot be reduced to a simple rule set. However, knowing about the nature of the performance being tested can to guide the tester toward or away from fractional test designs. 

Fractional Factorial Case Example


An example helps illustrate the workings and potential limits of a fractional approach. A team decides to test for response time in system with the three factors (workload, number of servers and security overhead), and using just four test cases illustrated on the cube. Each test result for response time (unitless for simplicity) for each factor combination is shown at its corresponding location on the test case cube (Figure 3). Response time is considered a “fail” when above 300. 

Six Sigma Tutorial and Material, Six Sigma Learning, Six Sigma Certification, Six Sigma Preparation, Six Sigma Exam Prep, Six Sigma Career
Figure 3: Fractional Test Design Response Time Measured in Four Test Cases

As mentioned, the cases that are included in a fractional design can be used to predict the results for cases not done. None of the tested cases failed, but the results were used to interpolate the untested cases. Figure 4 illustrates those predicted values.

Six Sigma Tutorial and Material, Six Sigma Learning, Six Sigma Certification, Six Sigma Preparation, Six Sigma Exam Prep, Six Sigma Career
Figure 4: Fractional Test Design Predicted Response Times for Cases Not Run

In this case, the fractional data suggests that the case in the upper right corner of the cube could be a “fail” condition (response time greater than 300). Actual testing at the point bears that out. 

Table 2: Predicted Versus Actual Response Times at Points Initially Untested

Test Cases   Response Time 
Workload Servers Security Predicted  Actual 
Small  3  High  268.04 264.8
Small  6  Low 281.40  260.8 
Large  3  Low  266.36  277.7 
Large  6  High  312.20  302.8 

Looking at Fractional DOE Drawbacks and Risks


The case so far describes a situation where a fractional approach paid off. Testers are not always so lucky. As discussed, if one or more factors influences the test result in a discontinuous way or if there are large unaccounted interactions between the factors, a single point that is left out in a fractional design can be the one place that the system comes to its knees. Where that concern is active there is no substitute for actually observing the cases with highest risk. 

It should be noted that there are interim strategies that combine fractional designs supplemented with cases of special risk (and perhaps excluding cases known to be very low risk). Some DOE software offers “D-optimal” designs, which basically ask for information about: 

◉ How many cases are there time and resources to do
◉ The factor effects and interactions to study
◉ Any test cases that should be excluded (already tested or impractical)
◉ Any test cases that should be included (special risk or interest)

From there, D-optimal design software searches for the best set of test cases that fit the test needs and resource constraints. 

Looking at More Test Factor Combinations


A quick tour of a larger fractional test case may round out the picture a bit. The test setting for the three factors used here actually includes three others as well – Client CPU (2.8, 4.0) Server CPU (3.5, 4.5), and data compression (light, complex). Testing response time for all six factor combinations would call for 64 cases (26). 

A fractional design of only eight cases was used, replicating each test (to observe response time variation) to give a total of 16 test cases. This is still just 25 percent of the exhaustive plan. 

Figure 5, showing the distribution of results, indicates that about 25 percent of the cases were failures. 

Table 3 sorts the results, isolating the failures. It can be seen that no one factor is responsible for the failures. As expected, it is the combined effect of all the factors in concert that drive the overall result. Using that rule of thumb in this case, every factor except Client CPU could be deemed significant. There is a lot more involved in interpreting these outputs, but the focus here is only on the simple basics.

Six Sigma Tutorial and Material, Six Sigma Learning, Six Sigma Certification, Six Sigma Preparation, Six Sigma Exam Prep, Six Sigma Career
Figure 5: Distribution of Test Results

Table 3: The Sorted Details – Failures Top the List
Workload Client CPU  Server CPU  Compression  Security  Servers  Response Time 
Large 2.8 3.5 Light Low 6 318.4
Large  4.0  4.5   Complex  High  6  310.7 
Small 2.8  3.5  Complex  High  6  308.0 
Large  2.8  3.5  Light  Low  6  302.5 
Small 4.0  3.5  Light  High  3  301.9
Large 2.8  4.5  Light  High  3  299.6 
Small 2.8  3.5  Complex  High  6  298.3 
Large 4.0  4.5  Complex  High  6  290.1
Large  2.8  4.5  Light  High  3  281.2 
Large  4.0 3.5  Complex  Low  3  275.4 
Small  4.0  4.5  Light  Low  6  272.4 
Large  4.0  3.5  Complex  Low  3  268.8 
Small  4.0  3.5  Light  High  3  266.8 
Small  4.0  4.5  Light  Low  6  265.3 
Small  2.8  4.5  Complex  Low  3  232.9 
Small 2.8  4.5 Complex  Low  3  210.0 

Figure 6 shows how the analysis of variance (ANOVA) can be used to single out the impacts of each factor on the test result. The slope of each line provides a quick visual cue to each factor’s relative impact. Client CPU has the least impact (almost a flat line) and number of servers has one of the strongest impacts. 

ANOVA further quantifies factor effects, as shown in Table 4. The “sequential sum of squares” for each factor gets larger as the factor shows more influence, and the p-value for each factor gets smaller (in its 0-to-1 probability scale) as the factor influence is seen as statistically more significant. Experimenters often use a p-value threshold of about 0,10, view factors with values below that level as worthy of attention and inclusion in the model. 

With this plan, the failures detected and those predicted (for the untested cases) found about 95 percent of the fail conditions that were uncovered in a follow-up exhaustive test. There is no guarantee, of course, that any particular application will find similar results.

Six Sigma Tutorial and Material, Six Sigma Learning, Six Sigma Certification, Six Sigma Preparation, Six Sigma Exam Prep, Six Sigma Career
Figure 6: Factor Effects on Response Time

Table 4: Analysis of Variance for Response Time, Using Adjusted Sum of Squares for Tests
Source DF  Seq.SS  Adj.SS  Adj.MS  F  P 
Workload 1 2282.5 2282.5 2282.5 13.17 0.005
Client CPU  1  0.0  0.0  0.0  00.00  0.993 
Server CPU  1  1978.0 1978.0  1978.0  11.41  0.008 
Compression  1  810.8  810.8  810.8  04.68  0.059 
Security  1  2779.9  2779.9  2779.9  16.04  0.003 
Servers  1  3280.4  3280.4  3280.4 18.93  0.002 
Error  9 1559.8  1559.8  173.3     
Total  15  12691.4        
S = 13.1646 R-Sq = 87.71% R-Sq (adj) = 79.52%