Monday, 6 July 2020

The benefits of PRINCE2 Agile®

PRINCE2 Agile, PRINCE2 Study Material, PRINCE2 Exam Prep, PRINCE2 Certification

When one of the world’s most recognised project management certifications, PRINCE2®, announced its new agile sibling back in 2015 it caused quite a stir, and for good reason.

Bridging the gap between what is seen as a more ‘traditional’ project management methodology, and the techniques that make agile approaches so successful in their own right, PRINCE2 Agile® gives the best of both worlds. So what exactly are some of its benefits? Let’s break it down for you…

It’s adaptable


As it’s based on the PRINCE2 framework, PRINCE2 Agile can be applied to any project environment with ease, providing guidance that can be adapted and tailored depending on your industry sector, size of project, product type, the list goes on. It’s collaboratively built and can be used with any established agile approach, so your possibilities are well and truly endless.

It’s a good introduction to agile


If you’re already using PRINCE2 in your organisation, PRINCE2 Agile is a good way to start introducing agile techniques without, essentially, ripping everything out and starting over. Equally, there are no pre-requisites to sit the Foundation course, and if you already have PRINCE2 Practitioner then you can jump straight to the Practitioner level of PRINCE2 Agile – happy days!

It focuses on both the project and the outcome


While agile techniques are great for ensuring that you get the highest quality and best value out of your product at the delivery level, it can help to add in some structure to aid the management of the actual project itself. Ensuring that your projects adhere to the strategic objectives of your business is where PRINCE2’s framework comes in really handy.

It’s widely used


With PRINCE2 already being one of the most widely accepted project management methodologies in the world, getting a PRINCE2 Agile qualification will serve you in good stead. Whether your current organisation already uses PRINCE2, and they’re looking for a way to incorporate agile into their projects, or you’re looking for an agile certification that will help you in your future job prospects, you’re sure to reap the benefits of PRINCE2 Agile’s popularity.

You can start seeing value earlier


One of the main features that characterises agile projects is the collaborative, incremental style of delivery. Unlike some more traditional methods, where you may only be able to see the finished product or products at the end of the project, PRINCE2 Agile’s incremental delivery process allows you to start benefiting from the value of your product(s) in stages throughout the project.

It’s the perfect blend


If you wanted to, you could try to incorporate agile techniques into your projects without a qualification. However, you may find that the differing approaches often conflict with one another, having a detrimental effect on your projects. With PRINCE2 Agile, you’re taught how to get the best out of both approaches, with little to no conflict whatsoever – the dream!

Friday, 3 July 2020

Using Monte Carlo Simulation as Process Control Aid

Six Sigma Exam Prep, Six Sigma Certification, Six Sigma Learning, Six Sigma Tutorial and Material

Monte Carlo simulations are often used as a powerful tool in the Analyze or the Improve phase of a Six Sigma DMAIC (Define, Measure, Analyze, Improve, Control) project. For instance, Monte Carlo simulations can be used to improve the capability of processes. The Monte Carlo simulations can quantify the expected variation improvement. However, simulations are not only very powerful when utilized in the earlier phases of a DMAIC project, they also are a powerful tool in statistical process control.

Methodology


A project involving carbon nanotubes (CNTs) provides an example.

Six Sigma Exam Prep, Six Sigma Certification, Six Sigma Learning, Six Sigma Tutorial and Material

Carbon nanotubes have become the basis of intense research due to their intriguing mechanical and electrical properties. In Motorola’s Embedded Research Systems Laboratory CNT’s electrical conductivity and high aspect ratio (length in the m, diameters in the nm range) have been utilized in one particular application for field emitter displays. The adjacent image shows a 4.6-inch display where millions of CNTs have been selectively deposited on a glass cathode while their emission has been regulated for display function.

Such fully processed displays represent a considerable resource commitment due to their manufacturing complexity. Therefore, blanket, non-patterned, diode samples were initiated as test and optimization vehicles. CNT growth was achieved by a two-step deposition process – first a metallic catalyst is deposited in a separate tool, followed by the deposition of the CNTs in a chemical vapor deposition reactor. After deposition of the CNTs, the emission properties were investigated by extracting the emission current on an anode and exposing the CNTs to an electric field. The current density was an indicator of brightness, convoluted by the phosphorus efficacy of the anode.

The brightness of the display was maximized using a classical design of experiments (DOE) approach in what is called subsequently the “laboratory phase.” The most efficient method for optimization is a sequential approach that is partitioned into three separate components – screening DOE, path of steepest ascent (PoA) and response surface method (RSM), as illustrated in Figure1. Off-the-shelf software was used for the statistical analysis. The sequential experimental approach allowed for resource efficient optimization of the emission current density. Typically, this three-tiered approach is now used in Monte Carlo simulation to predict the process variability followed by laboratory verification runs. In the approach illustrated in Figure 1, it is demonstrated that the Monte Carlo simulation in what is termed the “simulation phase” also can be used as a process troubleshooting tool and may lead to discoveries of hidden influential factors. Simulation software was used to carry out the Monte Carlo simulation. The statistical model obtained from the laboratory phase was used as a transfer function to calculate the expected emission output current density. Since the control of the significant factors is limited, their variation led to a distribution of the resulting emission current density.

The DOE demonstrated that the output distribution is critically dependent on the input variation distributions. By systematically changing the significant factor distribution in a computer experiment, a good fit to the measured emission current density was obtained. Then the obtained response model can be analyzed for its sensitivity to the input distributions. The response model also can be used to detect significant deviations, for example, deviations caused by a process shift, from the expected output curve.

Six Sigma Exam Prep, Six Sigma Certification, Six Sigma Learning, Six Sigma Tutorial and Material

Figure 1: Flowchart of the Experimental Procedure

Laboratory Phase


A screening DOE (½ fraction of a 2-level, 4-factor resolution, IV, 24-1IV) was carried out in the initial phase to reveal what factors had significant influence on the emission current. The Pareto chart in Figure 2 identifies the two most significant factors, A and B, whereas D had only a minor influence. It also shows that some interaction between A and B was present and Factor C had no impact. The inset displays the residuals of the statistical model plotted against the most significant Factor A. The response surface was curved; therefore a RSM was required for true optimization.

Six Sigma Exam Prep, Six Sigma Certification, Six Sigma Learning, Six Sigma Tutorial and Material

Figure 2: Pareto Chart of the Standardized Effects

Six Sigma Exam Prep, Six Sigma Certification, Six Sigma Learning, Six Sigma Tutorial and Material

Figure 3: Contour Plot of Transformed Emission Current Density

Six Sigma Exam Prep, Six Sigma Certification, Six Sigma Learning, Six Sigma Tutorial and Material

Figure 4: Contour Plot of Emission Current Density (mA/cm2)

In the contour plot of Figure 3, an inverse square root transformation was used on the emission current density to normalize the data and plotted versus the two most significant factors – A and B. The analysis of variance (ANOVA) table is given in the inset. Results of Figure 3 indicated that in order to improve emission current density, Factor A should be increased and Factor B decreased. This course was pursued with the PoA. It rapidly became clear that while Factor A was easily controlled and increased, Factor B was not. Lowering Factor B below a certain threshold resulted in loss of controllability and a compromise had to be found. Therefore the most flexible and most important factor was Factor A. As Factor A was steadily increased a local maximum for emission current was found with the RSM centered on that new high point.

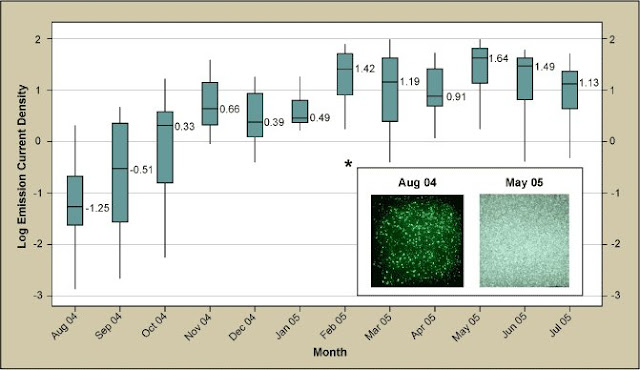
The results of the RSM are shown in Figure 4 with the ANOVA table as an inset. The contour map of the model obtained by the analysis indicates the region of maximized emission current. Figure 5 illustrates the effect of the optimization experiments. The boxplot summary of the emission current density is shown over time grouped by month. The current density is plotted on a logarithmic scale (each of the dashed lines representing one order of magnitude) and the median values for each month are indicated in bold numbers. It can easily be seen that the improvement equates to more than three orders of magnitude (from ca. -1.25 to ca. to +1.3, averaged over the last six months). The two images of the inset of Figure 5 illustrate the increase in brightness. The shutter speed of the camera had to be reduced by ca. 100x due to the much higher emission after the RSM. If the camera shutter speed had been left the same, the right image would be overexposed. Nonetheless, the improvement is not only noticeable in the brightness but also in the much higher density of emitters.
Six Sigma Exam Prep, Six Sigma Certification, Six Sigma Learning, Six Sigma Tutorial and Material

Figure 5: Box Plot of Emission Current Density Over Time

To this point the CNT growth project appeared to be a conventional Six Sigma DMAIC project with significant and quantifiable improvement. The Control phase started and for several months the emission stayed at a high level. However, in the fourth quarter of 2005 the process unexpectedly underwent a shift to lower emission. Since Factor A had been identified as most important and controllable factor, initial investigation focused on this factor, however, it was found that it was within the expected fluctuations. No clear explanation could be derived from the inherent variations of the other significant factors either.

After a more thorough investigation, the root cause was identified as an underlying factor relating to the catalyst thin film surface morphology that had not been measured directly. The characterization required to obtain the film surface morphology data on a regular basis had been excessively time- and labor-intensive. It took nearly two months of thorough experimentation and painstakingly characterization to bring the process back into control. The question became: Could this shift have been prevented? One obvious answer was that the correct parameter needed to be tracked, however, in this case the parameter was unknown. Could the shift of the process still have been prevented, and if so how?

Simulation Phase


In a typical DMAIC improvement project the process improvement is followed by some experimental verification runs followed by the capability analysis. The proposed method is to have the laboratory phase followed by a simulation phase to aid in the Control phase and to avoid costly process shifts even when hidden factors are important.

Optimized process conditions had been obtained and implemented, but how robust was the emission current density due to process input parameters, Factors A, B and D? If no variation to the optimized process parameters existed, the transfer function, obtained from the statistical model, could simply be used – taking into account the model error – to accurately calculate the expected emission current density output. As that is an idealized scenario even with the best controls in place, it becomes critically important to study the effect of process input fluctuations on the output.

No historical data for any of the factors existed. However, during the improvement project, data collection on the most significant factor, Factor A, was initiated (after some hardware modification on the tool). Since it took considerable time to collect enough data to be statistically viable, best guess estimation for all three significant factors, A, B and D had to be done. Normal distributions with standard deviations of 20 percent, 20 percent and 10 percent of the respective means were assigned to the three factors (the latter variable was more effectively controlled) and Monte Carlo simulation carried out. The resulting output emission current distribution was then compared to the measured data, as shown in the flowchart of Figure 1. The simulated and measured data were equally divided into equivalent bins and the difference for each bin calculated. The sum of squares of these bins was then used as the response in an optimization Monte Carlo RSM.
Six Sigma Exam Prep, Six Sigma Certification, Six Sigma Learning, Six Sigma Tutorial and Material

Figure 6: Overlaid Simulations with Varies Degrees of Variation of Factor A

Factor A was identified in the very first screening DOE as the most significant factor on the emission current density and Figure 6 shows several graphs overlaid with Factor A input variation from 5 percent to 50 percent. It can be seen that this variation has a substantial effect not only on the range but also on the shape of the current density distribution. The smallest variation in Factor A resulted in the sharpest peak with a very high kurtosis.

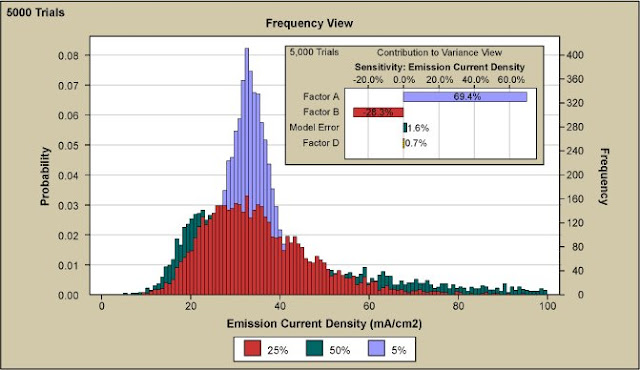
As the variation is increased it can be seen that the curve broadens considerably. However, the broadening disproportionately occurs at the upper end of the emission curve while no important effect is observed at the low end of the spectrum. Only the introduction of a much higher value than the experimental set point in combination with greater variation of Factor B, as seen in Figure 7 allowed for the extension of the emission current histogram towards zero emission and thus achieve a good fit to the measured data. In the figure, Factor B and its variation on emission current density curve came from 5000 simulation trials. Factor A variation was held constant at 50 percent.

Six Sigma Exam Prep, Six Sigma Certification, Six Sigma Learning, Six Sigma Tutorial and Material

Figure 7: Simulation Software Output Showing Influence of Factor B

Six Sigma Exam Prep, Six Sigma Certification, Six Sigma Learning, Six Sigma Tutorial and Material

Figure 8: Overlay Plot of Monte Carlo Simulation of Emission Current Density and Measured Data

The resulting final fit to the measured emission current density output distribution is shown in Figure 8. The fit was obtained with a 50 percent variation of the most significant Factor A, 78 percent variation of Factor B and Factor D stayed at 10 percent variation. Inset is a simulated run with the same amount of runs as the measured data.

The curve of measured data appear somewhat serrated compared to the fitted curve which may be explained by the limited number of 230 data points when compared to about 4 million simulated data points. The inset of Figure 8 shows the result of a simulation with only 230 runs (i.e., the equivalent number of measured data). The graph is very similar to the measured data, as it displays again a certain degree of unevenness and some bins that are not occupied. Therefore, the discretization of the data seems to be due to the low number of measured data relative to the simulation. As mentioned, during the improvement process the measuring of Factor A run-to-run variation was initiated. As illustrated in Figure 9, the measured Factor A variation has a standard deviation of 42 percent of the mean and agrees quite well with the 50 percent of simulated curve. Also shown are the Factor B and D variation.

Six Sigma Exam Prep, Six Sigma Certification, Six Sigma Learning, Six Sigma Tutorial and Material

Figure 9: Distributions of All Process Input Factors After Good Fit to Measured Data

The high Factor B variation was unexpected. The large fluctuation of Factor B was directly related to an underlying factor that dramatically decreased the emission current density. The morphology was crucially influenced by any fluctuations or drift in Factor B. The instrumentation that controlled Factor B was indicating no drift and the important influencing underlying factor was not known at the time, thus leading to the drift.

Wednesday, 1 July 2020

The benefits of PRINCE2

Prince2 Study Material, Prince2 Guides, Prince2 Certification, Prince2 Learning

Whether the name ‘PRINCE2®’ means nothing to you – ‘Prince who?’, we hear you ask – or it’s mentioned so often that your interest is well and truly piqued, there’s a reason it’s one of the world’s most popular project management methodologies.

88% of project managers with a PRINCE2 qualification say that it has helped them in their career, and the project success rate for those holding a PRINCE2 certification is a massive 67%. While these numbers speak for themselves, in this blog we’ll be detailing some of the key ways in which PRINCE2 can benefit both projects and project managers alike.

It’s tailorable


PRINCE2’s framework can be tailored to any project environment. Whether it’s the size or type of project, the organisation’s individual needs or the industry sector, PRINCE2 is flexible enough to be adapted efficiently without losing any of its effectiveness, even in agile projects.

It’s widely recognised


There are over one million certified PRINCE2 professionals across the globe, and 59% of all project managers hold a PRINCE2 qualification2. With numbers that big staring you in the face, it’s hard to deny PRINCE2’s popularity. In fact, these days it’s often the case that employers will actively look for the certification when recruiting. With the methodology being so widespread, getting PRINCE2-qualified can not only increase your credibility as a project manager, but it can expand your network and opportunities worldwide.

It introduces a common vocabulary


By managing your projects under the PRINCE2 framework, you’ll be introducing an established vocabulary into your business, which will aid communication and help your projects run more efficiently. And another benefit of PRINCE2’s international renown is that this vocabulary is common amongst project managers and businesses worldwide, so understanding it can further boost your integrity and career opportunities.

It’s relevant at all stages of your career


Whether you’re just starting out in project management, or you’re a seasoned pro with years of experience, PRINCE2 is relevant to you. From helping you to structure and manage your first project with its emphasis on managing by stages, to improving the way your existing project team functions with its keen focus on roles and responsibilities, PRINCE2 is useful regardless of your experience level.

It’s compatible with other qualifications


The beauty of PRINCE2 is that you can combine it with any other project management qualification. By providing the technical framework from which you can structure your projects, it allows space for you to integrate softer skills and techniques from other certifications.

It’s product-focussed


This may seem an obvious one, but it’s important to highlight. PRINCE2’s focus on the product(s) of a project from the very beginning means that all your efforts are rooted in the end goal, rather than the process by which you get there. Ultimately, this will help your projects to run more smoothly, and it will help your project team to work more effectively.

Source: prince2.com

Monday, 29 June 2020

Perfect Your Predictions with Yield and Single-Use Reliability Modeling

Six Sigma Tutorial and Materials, Six Sigma Learning, Six Sigma Exam Prep, Six Sigma Guides

Yield is a key parameter in most manufacturing processes – tied to financial results, delivery and quality as shown in Figure 1.

Six Sigma Tutorial and Materials, Six Sigma Learning, Six Sigma Exam Prep, Six Sigma Guides

Figure 1: Yield Tied to Gross Margin and Delivery

Yield modeling allows the team to predict future yield and prioritize opportunities to improve yield. A yield model combines predicted yields for each step of the process into a predicted yield distribution for the entire manufacturing or assembly process.

Single-use reliability or mission reliability is analogous to yield modeling and refers to the overall probability of success, such as the success of a military mission, the launch of a satellite, or the probability of success for a medical procedure. The overall probability of success for the mission or procedure is a combination of the probabilities of success for each step in the mission or procedure, similar to steps in a manufacturing process.

By using either – or both – of these models, you can better prioritize your processes for improvement.

The probability of success for each step of a process, procedure or mission can range between 0 percent to 100 percent, so it can be modeled using a statistical distribution that ranges between 0 percent and 100 percent, such as a beta distribution. The overall probability for success of the process, mission or procedure also can range between 0 percent and 100 percent, and can likewise be represented by a beta distribution. Fortunately, combining the probabilities of success for each step by multiplying beta distributions for each step results in another beta distribution representing the probability of success for the mission, procedure or process.

Beta Distributions

Beta distributions, initially referred to as Pearson type 1 distributions, represent the family of distributions bounded by 0 percent and 100 percent. The beta distribution has two parameters, often referred to as alpha and beta. Insight into the meaning of alpha and beta parameters can be provided by analogy to the Bernoulli and the binomial discrete distributions.

On an individual basis, a part can pass or fail or a step in the process can experience success or failure; this can be represented by the Bernoulli distribution. If there is a set of five parts or five iterations of the process step, this can be represented by the counts of successes among five Bernoulli distributions; the distribution of the numbers of successes among the five Bernoulli distributions will give the same result as a binomial distribution for the counts of the number of successes among a set of five trials. Figure 2 shows the overlay of binomial distribution with probability of success per trial of 50 percent and five trials, compared to the sum of five Bernoulli distribution results each with a probability of success per trial of 50 percent.

Six Sigma Tutorial and Materials, Six Sigma Learning, Six Sigma Exam Prep, Six Sigma Guides

Figure 2: Overlay of Binomial Distribution

If the number of trials is much larger than five, the information will move from discrete counts of successes divided by total attempts and approach a continuous parameter, the probability of success.

Binomial and Beta Probability Equations

By analogy to the related binomial distribution, two parameters of the beta distribution, alpha and beta, reflect the expected number of good parts and bad parts, respectively. The equations of binomial and beta probabilities are as follows.

Binomial probability:

Six Sigma Tutorial and Materials, Six Sigma Learning, Six Sigma Exam Prep, Six Sigma Guides

Where s is the number of successes in n trials
Equation 1

Six Sigma Tutorial and Materials, Six Sigma Learning, Six Sigma Exam Prep, Six Sigma Guides

Equation 2

So, if a step in the process has been tried n number of times, and has succeeded s times and failed f =  n – s times, the probability of success can be estimated by a beta distribution with an alpha parameter of (s + 1) and a beta parameter of (f + 1), described as beta(s + 1, f + 1). This approach provides a useful way to model the probability of success for an individual step in a manufacturing process or mission or procedure using beta distributions.

If the success of a step in the process is based on a continuous parameter rather than a discrete pass/fail parameter, the probability of success can also be converted to a beta distribution. A measure of goodness for the continuous, such as Cpk, z-score or yield can be used to estimate the probability of passing, p. However, estimating the two parameters for a beta distribution require two values, and the probability of passing, p, must be supplemented by a second value.

This second value can be the number of samples, n, or a value for n can be assumed to reflect the degree of uncertainty in the Cpk, z-score or yield from the parameter distribution. Using the previously referenced analogy between the beta and binomial distributions, the variance of yield or single use reliability is variance = p(1 – p)/n. Values for alpha and beta can be estimated from these equations based on the beta-binomial distribution analogy shown in Equations 3 and 4.

Alpha ≈ (p2-p3)/Variance – p
Equation 3

Beta ≈ alpha*(1 – p)/p
Equation 4

Values for the alpha and beta for the probability of success can be estimated for each step – whether based on the actual or predicted numbers of passes and fails for a discrete parameter or the Cpk or z-score or yield for a continuous parameter. An example of this summary is shown in the table below of yield modeling for five process steps, some continuous (Cpk) and some discrete (pass/fail).

Six Sigma Tutorial and Materials, Six Sigma Learning, Six Sigma Exam Prep, Six Sigma Guides

Table 1: Yield Modeling

These values of alpha and beta for each step can be combined into overall probability of success for the overall process, corresponding to the overall yield for a manufacturing process or the probability of success for a procedure or mission, as shown in Figure 3. You can combine the values to use Monte Carlo simulation or another method based on the generation of system moments method. Both methods can provide sensitivity analysis that can help in prioritizing opportunities to improve yield or reliability, as shown in Table 2.

Six Sigma Tutorial and Materials, Six Sigma Learning, Six Sigma Exam Prep, Six Sigma Guides

Figure 3: Combined Distribution for Yield or Single Use/Mission Reliability

Six Sigma Tutorial and Materials, Six Sigma Learning, Six Sigma Exam Prep, Six Sigma Guides

Table 2: Average Yield and Variance Contribution from Each Step of the Process or Procedure

Since the combined distribution is represented by a beta distribution, a lower confidence limit for yield or single-use reliability can be established, as shown in Table 3.

Table 3: Yield or Single Use Reliability at 95% Confidence Using the Cumulative Beta Distribution Function 
LSL confidence interval 95%
Yield at 0.95 confidence   82.9% 

Friday, 26 June 2020

Leadership skills for the future

Prince2, Prince2 Study Materials, Prince2 Exam Prep, Prince2 Guides, Prince2 Learning

You may have felt tested in your role in the past few months, but rest assured, you are not alone! Collectively our management skills have been tried, pushed and developed in a crash course. Whilst there is no text book to answer “how to manage during a global pandemic”, you may have found yourself looking back to theory for how to best handle business disruption. You may have also looked to peers and even competitors for strategies and best practice approaches. However, now is the time to look within!

Take a moment to reflect and learn lessons from your own leadership skills during the coronavirus pandemic thus far. A pause of contemplation and self-reflection has the power to set you up to be a better leader going forward. Here are just some of the skills you may well have gained for the future:

Agility and adaptability


Whether you are well-versed in agile project management practices, or the concept is new to you, your agility will have undoubtedly been challenged by COVID-19. Extreme changes on a global level have affected business across the globe. As a manager this means your role will have been encompassed by change navigation. Adaptability has become vital, and there has been pressure for quick action like never before.

Going forward, so much will have been learned from this. It will surely impact the pace of your future decision-making, your ability to react and respond to bumps in the road on any project, and how to navigate through external changes.

Innovation


Innovation goes hand in hand with being agile and adaptable. As you decision-make, pivot and find solutions, you are innovating faster than ever before. Standing still has not been an option for companies during these unprecedented times, and so innovation has been crucial. Whether it has been repurposing existing products, relocating existing talents, finding new ways to deliver, or creating new products and services based on changing demands, or finding new markets.

Embrace this trend and become a team or company unafraid to try new things and continually reinvent, reimagine and create. Innovation will see your company thrive post lockdown. So, make a habit of being aware of shifts in the landscape and attentive to change. Become accustomed to seeing new opportunities and acting upon them.

The personal touch


A huge majority of us have gotten to know our neighbours more during lockdown, and there has been a real sense of community developing worldwide. People are looking out for one another, helping those who are struggling, and on the whole being more friendly and personable; we’re all in this together after all. This collaborative spirit is likely to have reached our work lives too.

As a manager in particular, you are likely to have checked in with your staff more than you would have done previously. In part, this is due to employees working remotely, but also because of the seismic changes which we have all had to deal with – it is always worth checking messages have been received and that individuals are on the right track. The takeaway from this being that you will likely know your team that little bit better on the other side of these testing times. Ensure that two-way communication and your personal touch continues, as it might just make you a better leader.

Positivity


It is key that we look for the positives to take from the COVID-19 situation. Being more personable, innovative and agile going forward is certain to benefit your work life. Further development of each of these traits and soft skills will be key to success. So, reflect on these takeaways, and others too - perhaps you have surprised yourself with how you’ve handled business communications throughout disruption, or ways in which you have lifted team morale. Beyond being prime examples for any future interviews, these success stories should give you the confidence to rise to new challenges. Establishing and advancing these skills could be fundamental in the future of your career as a leader.

Thursday, 25 June 2020

Lean Fills Prescription for Change at Hospital Pharmacy

The process improvement journey at Jordan Hospital took a large step forward last year when the organization was introduced to Lean Six Sigma concepts as part of a departmental optimization effort for its internal pharmacy. Jordan Hospital is an acute care, 150-bed, not-for-profit community hospital, serving 12 towns in Plymouth and Barnstable counties in Massachusetts, USA.

Jordan Hospital’s pharmacy is currently undergoing several major changes to improve operations, reduce costs and better serve the needs of customers via the application of Lean principles. The pharmacy, led by John Leone, director of pharmacy, is following Lean’s primary tenets to reduce the time the supplier takes to deliver a customer’s order, and to eliminate wastes (and costs) throughout the system.

The objective for the hospital, according to Russ Averna, leader of the hospital’s Lean program and the vice president of human resources, is to apply Lean principles to improve operations, reduce costs, and better serve the needs of customers. Many other industries, including those that are service related, have adopted Lean approaches to increase their effectiveness and efficiency.

To optimize the transformation to using Lean, the hospital worked with consultants to introduce the change management tools to a broad audience of people from different areas of the hospital. The objective was to identify potential problems surrounding upcoming changes and create actionable plans to mitigate concerns and foster facility-wide acceptance.

Building Consensus for Change


A project team focused on increasing the clinical role of pharmacists to create a new vision of the “pharmacist of the future.” Another team worked on enhancing the communication of all changes within the pharmacy, and planning to optimize the future integration of the oncology pharmacy staff with the oncology department to further improve patient care and reduce drug delivery turnaround time.

In addition to these consensus-building events, the leadership also challenged the pharmacy team to improve the current performance inside its own walls where there were opportunities for improvement, specifically looking at the first-dose process and IV/chemo preparation.

The first step was to understand the current state of the process. This included the development of a value stream map (Figure 1) to identify where there was waste in the process. The value stream map highlighted non-value-added steps, including significant wait times during which medication was not being processed (waiting on quality checks or delivery runs) as well as extensive travel distances for the technicians who had to fetch some medications from outside the immediate work area.

In addition to opportunities to reduce the overall product lead-time by improving the cycle time, travel distance and flow patterns, there was an issue of physical space constraints. This was relevant because space in the pharmacy was extremely tight and congested, with people running into each other while filling patient orders.

Six Sigma Tutorial and Material, Six Sigma Cert Exam, Six Sigma Learning, Six Sigma Prep

Figure 1: Value Stream Map

Rapid Results with Kaizen


The next step was to prepare for a Kaizen improvement activity. Kaizen is a Japanese word that means change for the better, or more commonly, continuous improvement. A Kaizen is a hands-on burst of improvement activity in the actual workspace that occurs during a relatively short period of time – usually three or four days.

A team, which was comprised of those who perform the activities every day, brainstormed improvement approaches, and then tested them on the actual production or service line (referred to as “trystorming”). This method results in rapid recognition of which solutions will work and which will not. The Kaizen team also created plans to sustain the gains once improvements were made, and developed reports to leadership on its actions.

In preparation, management set clear goals for the Kaizen team. The goals focused on creating a standard work environment and implementing an improved replenishment system using Kanban, a Japanese word meaning “sign board” or “signal.” Pharmacy Director John Leone said, “Despite the fact that our environment will change a lot over the next 12 months, there are many areas where we need to improve the process to optimize future changes. We assembled a great team, and we had every expectation they could achieve the targets.”

The first activity was a half-day training session to familiarize the team and attending executives with the Lean process improvement method and the Lean tools that would be used during the week. After the training was completed, the Kaizen began. The initial activity centered on a 5S of the pharmacy (sort, set in order, shine, standardize and sustain). This included evaluating the purpose and value of all supplies and activities in the work areas. This step alone cleared a significant amount of “clutter” from the area, improving visual control and eliminating several safety hazards. The 5S activity freed up an entire rack where medication that was no longer used was being stored.

Six Sigma Tutorial and Material, Six Sigma Cert Exam, Six Sigma Learning, Six Sigma Prep

Figure 2: Pharmacy Area Before and After 5S Activity

Creating and Sustaining Change


The team then split up and focused on the “bug juice” preparation process and on the IV preparation process and replenishment of this area. As soon as the teams agreed on how to approach the individual problem, they went ahead and dove into the “trystorm” phase where they implemented their ideas. The bug juice team quickly identified and implemented a visual aid and a standard process that would increase communication and reduce the amount of “waste” produced due to communication and replenishment issues with the operating room team.

The IV prep team implemented a two-bin replenishment system close to the point where the medications were used. The two-bin system prevents overstocking of material, provides a mechanism to assure first-in-first-out inventory management and supports a much more just-in-time-driven replenishment.

In addition, the workspace for frozen IV preparation was moved from a congested area to a new location in the space that was recovered through the 5S activity. In the newly created space, workers could focus on the delivery quality of this task without being interrupted. The original IV area had no clear organization of inventory near by. The new IV area had point-of-use equipment and frequently used inventory visible.

Six Sigma Tutorial and Material, Six Sigma Cert Exam, Six Sigma Learning, Six Sigma Prep

Figure 3: The Original IV Area and the New IV Area

The benefits for this 3.5-day project included a reduction of approximately 51 miles per year in travel distance for the technicians, a cycle time reduction of about 102 hours per year, plus additional space created in the tight area.

Six Sigma Tutorial and Material, Six Sigma Cert Exam, Six Sigma Learning, Six Sigma Prep

Figure 4: Filling IV Label – Before and After

Also, the “bug juice” improvements will reduce the waste of medication, which, before, was calculated to about $50,000 per year. Additionally, several safety issues were resolved on the spot, making the environment a safer place to work in. The group then created a 30-day follow-up plan to fully implement those changes that could not be completed within the Kaizen event week to assure that full benefits could be calculated and sustained.

The success of the project was credited to the make-up and performance of team members, the support given to the team, the constructive feedback given to the rapid changes, and the methods used to ensure that changes are communicated effectively. “We really emphasized the people side during Kaizen and the other activities. Change is difficult, but making sure we gave every opportunity to participate was key to the positive results we achieved,” Vice President Averna noted

Additional factors included thorough preparation, clear objectives, management support, a can-do and creative mindset, continuous communication with all affected areas, standardization of the improvements, and routine monitoring and tracking of improvements following implementation.

Monday, 22 June 2020

3 Ways to Speed Up Data Collection in Financial Service Processes

Six Sigma Tutorial and Material, Six Sigma Learning, Six Sigma Certification, Six Sigma Exam Prep

In any financial service process that is being studied for the first time, it is common for Six Sigma teams to spend one-third to one-half of their project time on data collection alone. It simply takes a lot of time to figure out what data is needed, to develop a reliable data collection process and to analyze the results. Here are three tips that can help teams get a fast start on data collection.

1. Monitor Some Baseline Metrics


Every improvement project will have its own unique data needs, but there are a number of metrics that are useful for determining overall process health, such as:

Work in process (WIP)/Things in process: The amount of work that has entered the process but has not been completed.

Average completion rate: The average number of work items that are completed in a given time period (a day, an hour, etc.).

Demand variation: The amount of fluctuation in the demand for the output of the process. The amount of work that arrives at a given activity is measured in terms of units/day and as an average completion rate per unit. Variation can be used in queuing theory to estimate the resulting delays that this variation causes.

First-pass yield: The percentage of things in process that make it all the way through the process the first time without needing to be fixed or re-handled in some way. First-pass yield is a good overall indicator of how well the process is functioning. It also reflects both Lean and Six Sigma goals: in order to have a high first-pass yield, the process must operate smoothly (i.e., with good process flow) and with few errors.

Approvals or handoffs: Two characteristics almost always seen in slow processes are 1) a lot of approvals before work can be completed or 2) a lot of handoffs back-and-forth between people or groups. In contrast, Lean processes operating at high levels of quality are characterized by many fewer approvals and handoffs. While having low numbers of approvals or handoffs does not guarantee having a Lean process, this is relatively easy data to collect and will almost certainly drop as the process improves.

Defects/Sigma capability: The Sigma level in Six Sigma is, of course, the rate of defects that occur per defect opportunity. The key is to come up with definitions that: 1) everyone in the team will interpret the same way and 2) are consistent with other definitions used in the organization. For example, when filling out a new customer account form, is every keystroke counted as an opportunity for someone to make a mistake? Or is the whole form one “opportunity”? Do typos count the same as omissions? It is best to focus on things that are important to customers. There are a lot of ways that a form, a report or a service can be technically “defective” in some way without it mattering to internal or external customers. For example, perhaps different employees do the work in a slightly different sequence. If “sequence” affects quality as perceived by the customer, then doing the steps in the wrong order is a defect that should be tracked. If sequence does not affect the customer, then there are probably bigger fish to fry elsewhere.

Cycle or lead time: How long it takes for any work item to make it through the process from beginning to end.

Setup, downtime: Any delays or productivity losses that occur when people switch tasks.

Measure these things early in a project, then again once improvements have been made to determine the impact. If the process being measured has a lot of steps and/or a lot of throughput (volume of work), consider measuring on a sample basis at first (e.g., randomly sample key steps).

2. Observe the Process


In the words of Yogi Berra, “You can observe a lot by watching.” There simply is no substitute for impartial observation as a way to confirm what really happens in a process. Impartial observations are critical in identifying waste and inefficiencies built into how work is currently done.

In an office environment, it is hard to observe the work itself, since it can take the form of emails, reports, phone calls or inputs to screens – some work products may exist only in a virtual sense. As a result, process observation in service environments means watching people and what they do. And there is the rub. Not many people like someone sitting at their shoulder, watching their every move.

For that reason, process observation in financial services often works best with trained observers, especially if they are seen as neutral parties (i.e., they come from a different work area, they are a trained Black Belt who has not worked in the area before, etc.). Also, office staff needs to be involved in setting the goals for the observation (“What will be learned from this?”) and in deciding when the observation will happen, which staff will volunteer to be observed, and so on.

The example below is a form that Lockheed Martin found invaluable in the early stages of improvement projects. It was used for verifying (or refuting) everyone’s ideas about what they think is happening, and for helping them zero-in on areas that need attention.

Six Sigma Tutorial and Material, Six Sigma Learning, Six Sigma Certification, Six Sigma Exam Prep
Example of Form Used for Process Observation

3. Collect Data by Participating in the Process


What better way to evaluate a particular service than by acting as a customer of that service? This can be done most easily by having a selected group of employees physically walk the process pretending to be an item of work – an incoming customer call, for example. What happens to the record of the call? Who works on it next? What happens at that work station? Where does it go after that?

Another approach is shared by Roger Hirt, a Black Belt with the City of Fort Wayne, Ind., who recalls one project where a team wanted to improve the quality of response to citizen calls. Instead of doing an after-the-fact survey of callers, they used secret shoppers, people who interact with the process just as real customers would. First, they provided the secret shoppers with standard scripts relating to different types of inquiry and complaint calls. They had these people call the city department at different times (so they would talk to different staff), then looked at how the staff had handled the calls. They discovered a lot of inconsistency in how staff recorded and categorized information, with the result that citizens weren’t always provided with correct answers or responses. This information allowed the department to develop training for everyone who received calls. A second secret shopper trial showed dramatically improved results.

Collecting data this way is a sensitive issue. On one hand, the idea is to be assured that the secret shoppers are getting service similar to what real customers would experience. But on the other hand, employees may be disturbed if the data collection comes as a complete surprise. Project Black Belts and improvement teams will have to make a judgment call about how much to tell people ahead of time.

Friday, 19 June 2020

What Are the Benefits of Lean Six Sigma for My Company?

Six Sigma Tutorial and Material, Six Sigma Learning, Six Sigma Certification, Six Sigma Exam Prep

Lean Six Sigma is a methodology and toolset that combines all the benefits of Six Sigma with those of Lean enterprise, so you can find the right tool for every job. Its aim is to identify and systematically remove defects and waste from every process within a company, organization or entity – in any industry, segment and business size.

Ultimately, the result of using Lean Six Sigma is improved efficiency within the company and a higher quality product or service for the customer. But there are some additional ways your company can benefit.

Financial Benefits


The financial benefits of Lean Six Sigma are large and well documented. Companies dedicated to implementing Lean Six Sigma not only see increased profits by reducing expenses, but can also benefit from an increase in revenue. For example, at North Shore-Long Island Jewish Health System, a radiology throughput project not only helped meet the demands of patients, providers and physicians, but it also generated an additional $375,000 per year in revenue.

Michael Cyger, founder and publisher of iSixSigma, discussed research conducted by his team in “Six Sigma Cost and Savings.” In that research, iSixSigma looked at the hard statistics recorded by Motorola, Allied Signal, GE and Honeywell and discovered that these companies experienced a year-on-year increase in savings and revenue growth, amounting to billions of dollars.

Research by Arvind Rongala of Invensis Learning has also found that enterprises that adhere to the Lean Six Sigma process improvement methodology achieved 40 percent more return on investment, or ROI, than those that didn’t.

Employee Satisfaction Benefits


Six Sigma doesn’t just improve the top and bottom line for your company, which shareholders love. Six Sigma employees themselves attest to improved job satisfaction.

One of the core tenets of Lean Six Sigma is to stop relying on the intuition and gut feel of managers to make the right steps for business operation and growth. Instead, empower every employee to make suggestions by teaching them how to collect and analyze data within their own process at work. They do this by giving them the Lean Six Sigma toolset.

Solving problems then develops confident employees who feel enabled to speak out, challenge the norm and enact real change for their customers and themselves.

At Black & Veatch Corp., a global engineering, consulting and construction company, human resource leaders found the causes of employee turnover and fixed their on-boarding process, reducing first-year voluntary turnover and eliminating $500,000 per year in costs.

Company Culture Benefits


The benefits earned by employees are not one off – they are cumulative.

Lean Six Sigma also has a follow-on effect as trained Green and Black Belts share their knowledge and reasoning with their colleagues in their current positions and as they rise up the ranks within their company and oversee their own teams.

Implemented correctly, with an awareness of the needs that motivate individuals and teams, Lean Six Sigma optimizes individual and team performance, which manifests itself in a culture of continuous improvement throughout the company.

Decrease in Error Benefits 


It’s often hard for employees to diagnose the root cause of a problem within a company and – as a result – time, energy and resources are wasted making superficial changes.

Lean Six Sigma simplifies processes by facilitating deep investigation and process understanding so that employees can root out the real issue that is causing customer-perceptible defects. Lean Six Sigma empowers your employees to take charge of improving their areas of expertise, and it gives them the skills to analyze data, identify problems and help to create effective solutions.

Satisfied Customer Benefits


If Lean Six Sigma is done properly, it starts with the customer and ends with the customer. The upper and lower specification levels for every product or service that the customer receives are determined, so the company can determine how well it is performing. If a company is out of specification, they know exactly what to work on to improve their processes and delight the customer.

Fewer customer complaints leads to fewer customer service inquiries, which leads to less rework to fix problems and bureaucracy to oversee the rework. It is well established that customer satisfaction leads to customer loyalty, which in turn influences the financial performance of the company.

Benefits of Lean Six Sigma to Your Company


The potential benefits for a company that embarks on a Lean Six Sigma initiative make it a worthwhile investment.

Though you can start to see results from the first year, the financial benefits grow as employees experience a culture change and take initiative to identify and eliminate waste.

And while Lean Six Sigma is not easy to implement, it is a competitive advantage for every organization – and an organization’s staff, customers and stakeholders will reap the benefits.